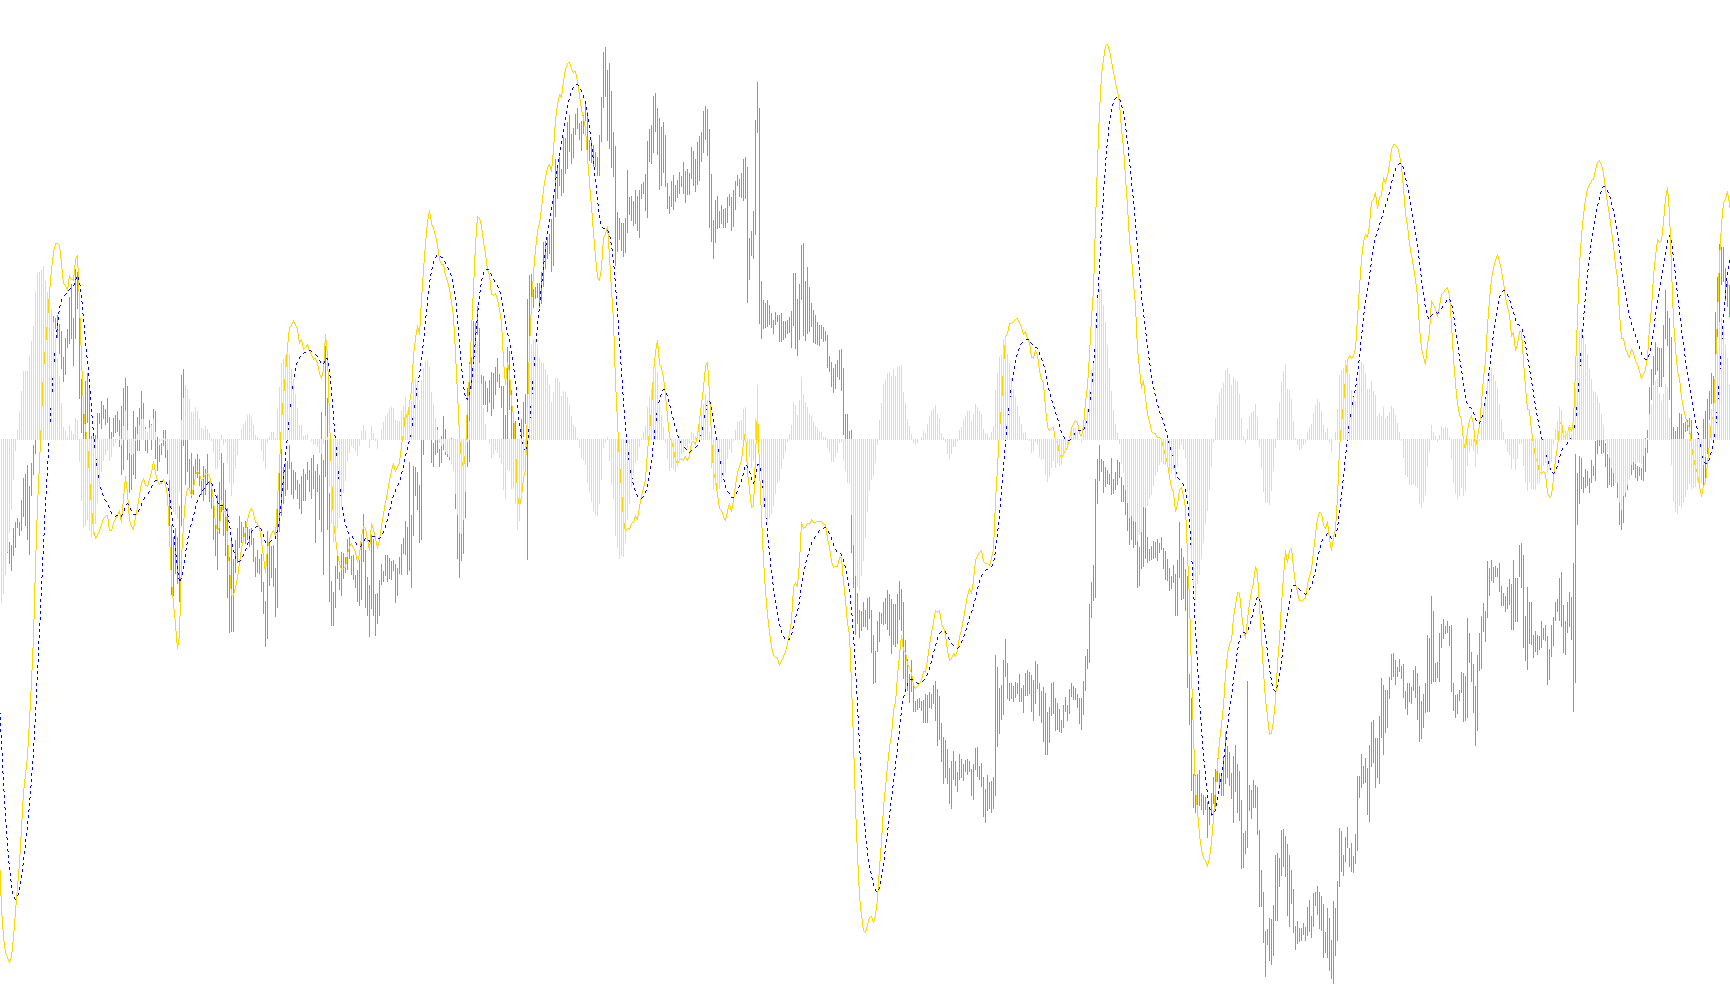
This script is designed to provide a visual analysis of market momentum by calculating and displaying the Moving Average Convergence Divergence (MACD) indicator. It functions as a secondary analytical tool, appearing in a separate window below your main price chart to help identify trends and potential shifts in market sentiment.
Core Logic and Components
The script operates by processing historical price data to generate three distinct visual elements:
1. The MACD Line The primary calculation involves comparing two different types of "Moving Averages."
- A Fast Moving Average tracks the price over a short period (default is 12 periods).
- A Slow Moving Average tracks the price over a longer period (default is 26 periods).
By subtracting the Slow average from the Fast average, the script produces the MACD Line. This line represents the distance between these two averages; when the gap widens, it indicates increasing momentum, and the direction of the line shows whether that momentum is moving upward or downward.
2. The Signal Line To help traders identify specific turning points, the script creates a "Signal Line." This is essentially a smoothed version of the MACD Line itself. It uses a mathematical smoothing technique (an exponential weighted calculation) to filter out minor price "noise." This line moves more slowly than the MACD Line and serves as a baseline for identifying potential trend reversals.
3. The Histogram The final visual element is the Histogram, which appears as vertical bars at the bottom of the indicator window. The height of these bars represents the difference between the MACD Line and the Signal Line.
- When the MACD Line is above the Signal Line, the histogram bars project upward.
- When the MACD Line falls below the Signal Line, the bars project downward.
How it Works in Practice
The script continuously scans your chart's price history, calculating these three values for every candle. By observing where the MACD Line crosses over the Signal Line—or by watching the Histogram flip from positive to negative—users can visually identify momentum shifts. The goal of this logic is to provide a clearer picture of the "rhythm" of the market, helping to distinguish between steady trends and temporary price fluctuations.
//+------------------------------------------------------------------+
//|                                                         MACD.mq4 |
//|                                Copyright © 2005, David W. Thomas |
//|                                           mailto:davidwt@usa.net |
//+------------------------------------------------------------------+
// This is the correct computation and display of MACD.
#property copyright "Copyright © 2005, David W. Thomas"
#property link      "mailto:davidwt@usa.net"

#property indicator_separate_window
#property indicator_buffers 3
#property indicator_color1 Blue
#property indicator_color2 Red
#property indicator_color3 DeepSkyBlue

//---- input parameters
extern int       FastMAPeriod=12;
extern int       SlowMAPeriod=26;
extern int       SignalMAPeriod=9;

//---- buffers
double MACDLineBuffer[];
double SignalLineBuffer[];
double HistogramBuffer[];

//---- variables
double alpha = 0;
double alpha_1 = 0;

//+------------------------------------------------------------------+
//| Custom indicator initialization function                         |
//+------------------------------------------------------------------+
int init()
{
   IndicatorDigits(MarketInfo(Symbol(),MODE_DIGITS)+1);
   //---- indicators
   SetIndexStyle(0,DRAW_LINE);
   SetIndexBuffer(0,MACDLineBuffer);
   SetIndexDrawBegin(0,SlowMAPeriod);
   SetIndexStyle(1,DRAW_LINE,STYLE_DOT);
   SetIndexBuffer(1,SignalLineBuffer);
   SetIndexDrawBegin(1,SlowMAPeriod+SignalMAPeriod);
   SetIndexStyle(2,DRAW_HISTOGRAM);
   SetIndexBuffer(2,HistogramBuffer);
   SetIndexDrawBegin(2,SlowMAPeriod+SignalMAPeriod);
   //---- name for DataWindow and indicator subwindow label
   IndicatorShortName("MACD("+FastMAPeriod+","+SlowMAPeriod+","+SignalMAPeriod+")");
   SetIndexLabel(0,"MACD");
   SetIndexLabel(1,"Signal");
   //----
	alpha = 2.0 / (SignalMAPeriod + 1.0);
	alpha_1 = 1.0 - alpha;
   //----
   return(0);
}
//+------------------------------------------------------------------+
//| Custor indicator deinitialization function                       |
//+------------------------------------------------------------------+
int deinit()
{
   //----

   //----
   return(0);
}
//+------------------------------------------------------------------+
//| Custom indicator iteration function                              |
//+------------------------------------------------------------------+
int start()
{
   int limit;
   int counted_bars = IndicatorCounted();
   //---- check for possible errors
   if (counted_bars<0) return(-1);
   //---- last counted bar will be recounted
   if (counted_bars>0) counted_bars--;
   limit = Bars - counted_bars;

   for(int i=limit; i>=0; i--)
   {
      MACDLineBuffer[i] = iMA(NULL,0,FastMAPeriod,0,MODE_EMA,PRICE_CLOSE,i) - iMA(NULL,0,SlowMAPeriod,0,MODE_EMA,PRICE_CLOSE,i);
      SignalLineBuffer[i] = alpha*MACDLineBuffer[i] + alpha_1*SignalLineBuffer[i+1];
      HistogramBuffer[i] = MACDLineBuffer[i] - SignalLineBuffer[i];
   }

   //----
   return(0);
}
//+------------------------------------------------------------------+
Comments