TrailCD
Download script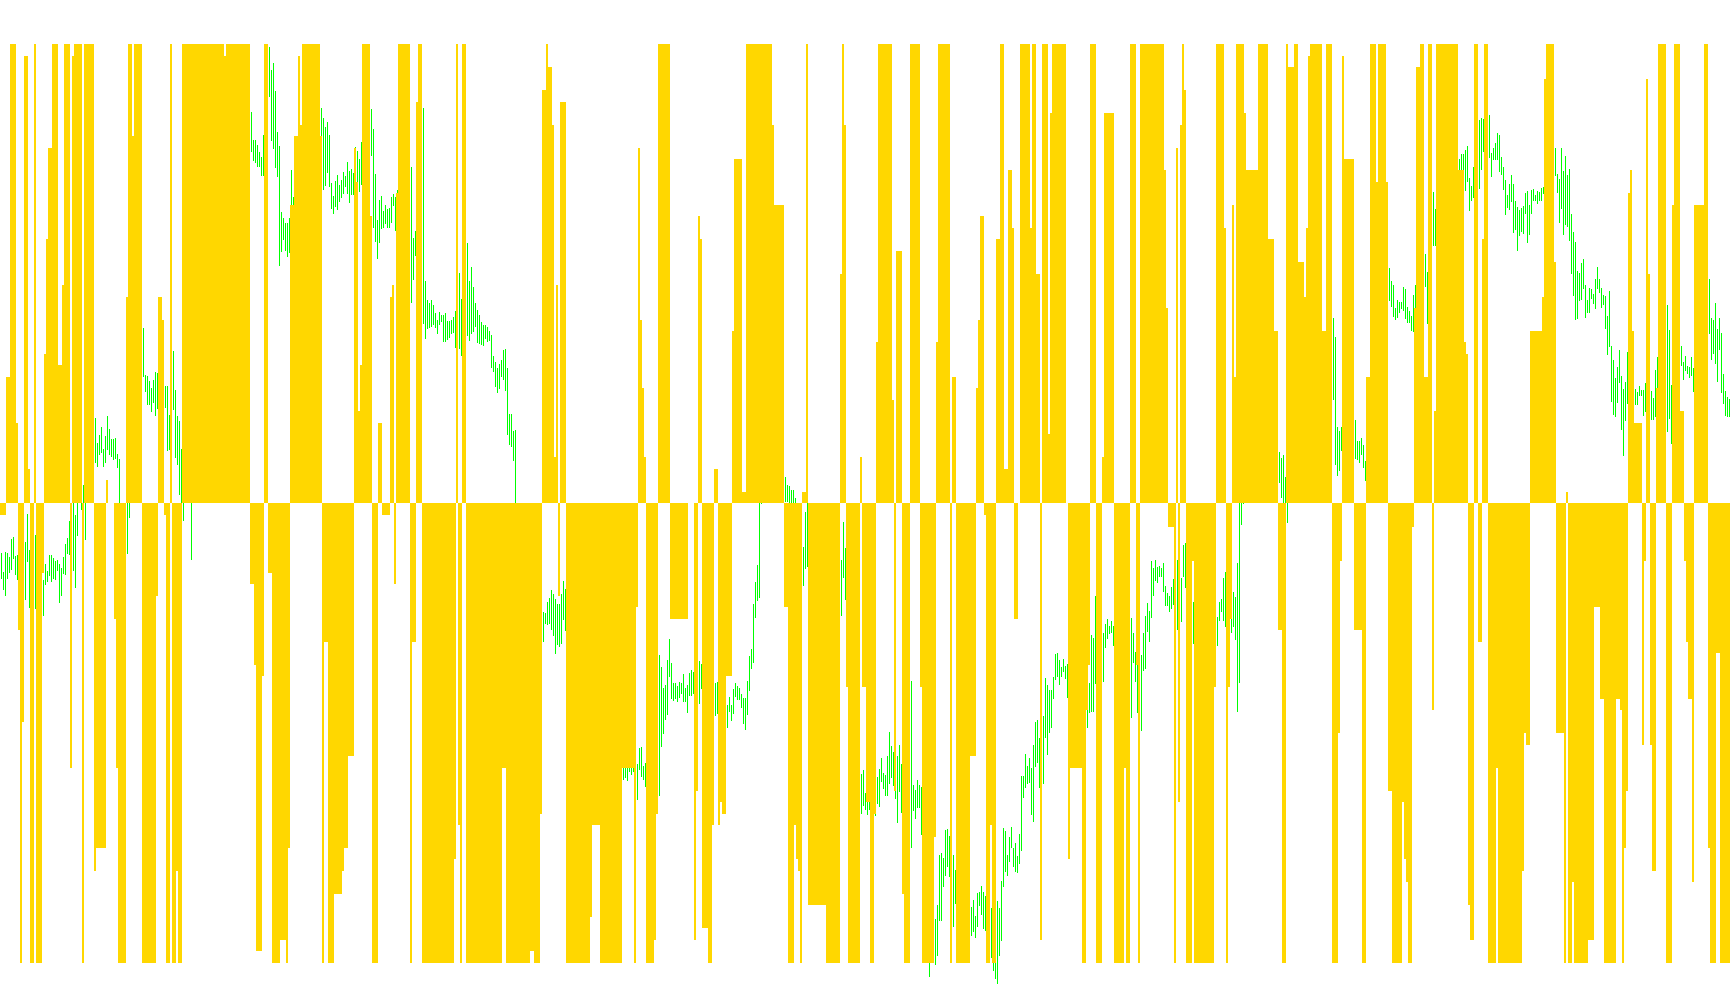
This tool is designed as a visual indicator for the MetaTrader platform, specifically engineered to help traders identify and measure momentum by tracking two distinct types of price "trails."
Core Concept
The logic operates by creating two moving benchmarks based on historical price action: a Fast Trail and a Slow Trail. Rather than simply following the current price like a standard moving average, these trails are designed to capture extreme shifts in direction while maintaining a sense of stability.
How the Logic Works
- Price Tracking: The script looks back at a specific amount of historical data (the user-defined number of bars) and analyzes the closing price of each candle.
- The Fast Trail: This benchmark reacts quickly to sudden price movements. It is programmed with a tight sensitivity limit. If the price moves significantly beyond this trail's current position, the trail "snaps" to that new level. It captures high-velocity trends but allows for some minor fluctuations.
- The Slow Trail: This benchmark is designed for stability. It uses a much wider sensitivity limit, meaning it takes a much larger and more sustained price move to force this trail to update. It acts as a heavy anchor, representing the broader trend of the market.
- Difference Calculation: The indicator does not plot these trails individually. Instead, it calculates the mathematical distance (the "gap") between the Fast Trail and the Slow Trail at every point in time.
Visual Output
The result is displayed as a histogram in a separate window.
- When the Fast Trail pulls away significantly from the Slow Trail, the indicator shows a larger value, signaling strong momentum in a specific direction.
- When the price consolidates and the two trails move closer together, the indicator shrinks, suggesting a period of market indecision or stabilization.
By monitoring the expansion and contraction of this gap, traders can visually assess whether the current market trend is accelerating, slowing down, or reaching a point of exhaustion.
Miscellaneous
8
Views
0
Downloads
0
Favorites
TrailCD
//+------------------------------------------------------------------+
//|                                                                  |
//|                        TrailCD.mq4                               |
//|Èíäèêàòîð                                                         |
//|Ñõîæäåíèå/ðàñõîæäåíèå áûñòðîãî è ìåäëåííîãî òðàëîâ                |
//+------------------------------------------------------------------+
#property copyright "mandorr@gmail.com"
#property indicator_separate_window
#property indicator_buffers 1
#property indicator_color1 SkyBlue
#property indicator_maximum  0.0050
#property indicator_minimum -0.0050
//----
extern int TrailFast=25;     // Áûñòðûé òðàë
extern int TrailSlow=65;     // Ìåäëåííûé òðàë
extern int CountBars=1000;   // Êîëè÷åñòâî îòîáðàæàåìûõ áàðîâ
//----
double buffer[];
//+------------------------------------------------------------------+
//|                                                                  |
//+------------------------------------------------------------------+
void init()
  {
   SetIndexStyle(0,DRAW_HISTOGRAM,0,2);
   SetIndexBuffer(0,buffer);
   SetIndexLabel(0,"Value");
   SetIndexDrawBegin(0,0);
  }
//+------------------------------------------------------------------+
//|                                                                  |
//+------------------------------------------------------------------+
void start()
  {
   ArrayInitialize(buffer,0);
   int price=MathRound(Close[CountBars-1]/Point);
   int value_fast=price;
   int value_slow=price;
   for(int i=CountBars-1;i>=0;i--)
     {
      price=MathRound(Close[i]/Point);
      if (value_fast<price-TrailFast) value_fast=price-TrailFast;
      if (value_fast>price+TrailFast) value_fast=price+TrailFast;
      if (value_slow<price-TrailSlow) value_slow=price-TrailSlow;
      if (value_slow>price+TrailSlow) value_slow=price+TrailSlow;
      buffer[i]=(value_fast-value_slow)*Point;
     }
  }
//+------------------------------------------------------------------+
Comments