FiboPiv_v3_v2
Download script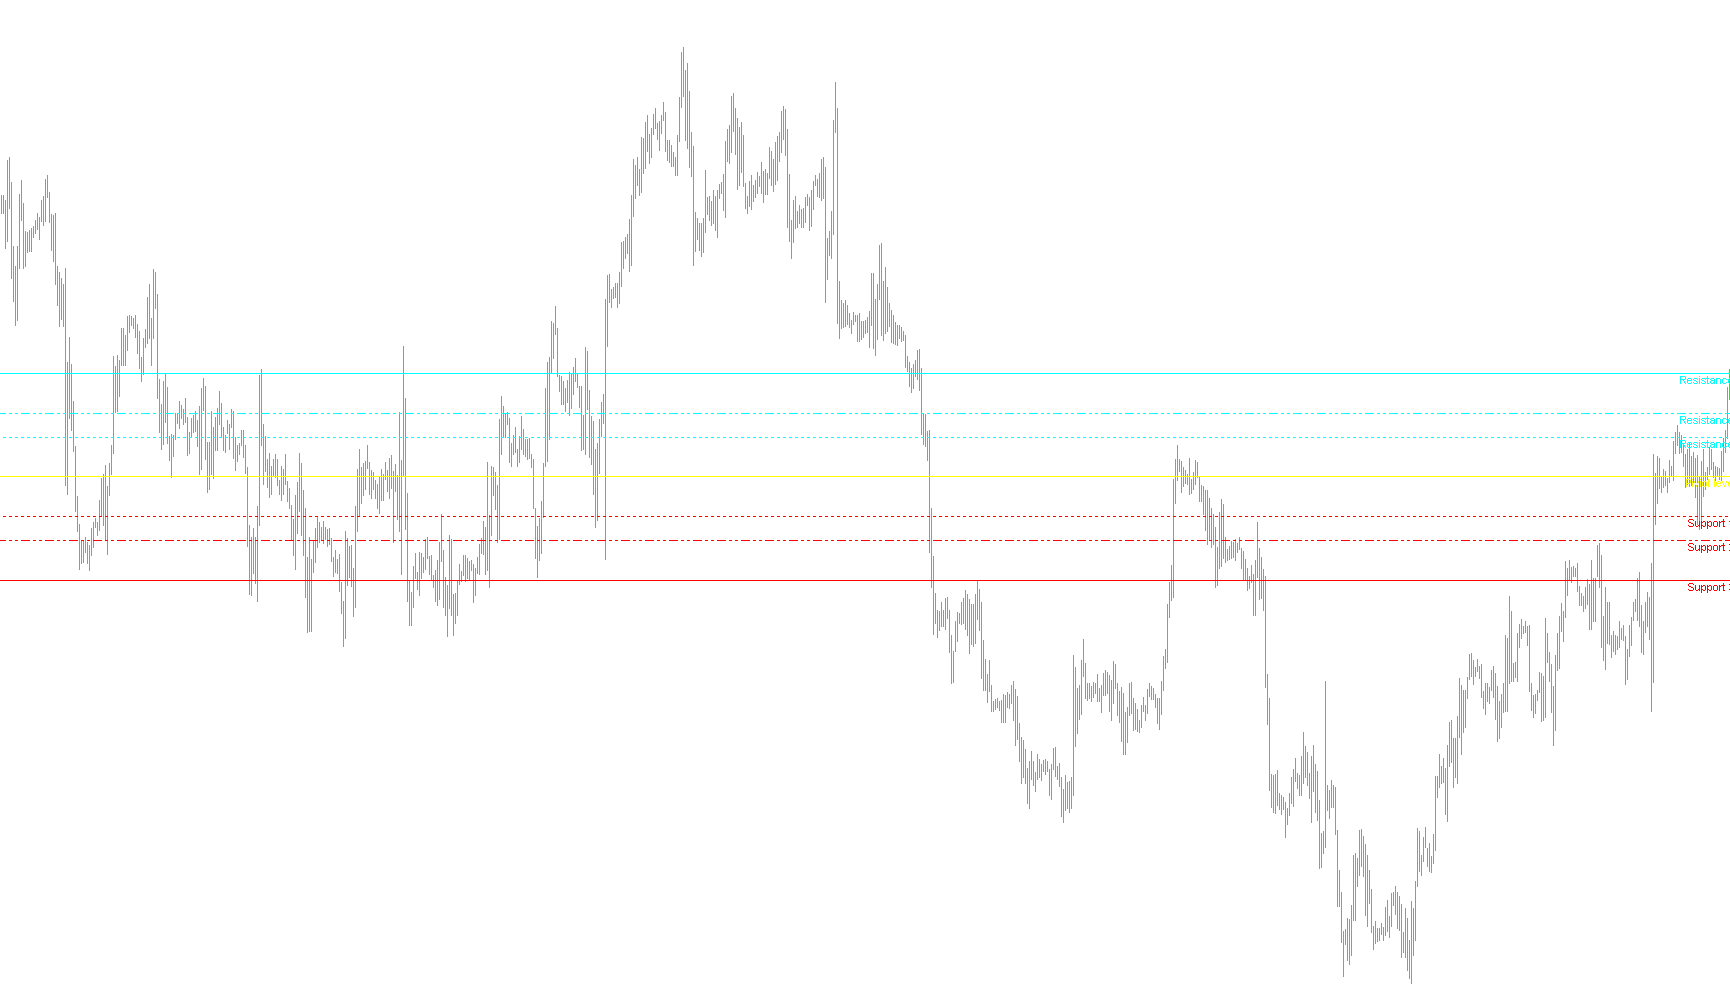
This tool is designed to automatically identify and project key price levels on your trading chart by analyzing previous market activity. It functions as a visual guide, helping traders identify potential areas of support and resistance where the price might react or reverse.
How the Logic Works
1. Data Gathering (The "Yesterday" Analysis) The script begins by looking at the completed price action from the previous trading day. Specifically, it identifies three key pieces of information:
- High: The highest price reached.
- Low: The lowest price reached.
- Close: The final price at which the market settled.
To ensure accuracy, the script includes "smart" logic for weekends. If you are viewing the charts on a Monday, it is programmed to look back past the weekend to find the last actual Friday of trading to ensure the calculations are based on valid market data.
2. The Pivot Calculation Once it has the High, Low, and Close from the previous day, it calculates a central point known as the Pivot. This is the mathematical average of those three figures. This "Pivot" acts as the equilibrium point for the current day's price action.
3. Dynamic Level Projection (Fibonacci Influence) Beyond just finding the center point, the script uses the total range of yesterday’s movement (the distance between the High and the Low) to project six specific levels across your chart:
- Resistance Levels (R1, R2, R3): These are projected above the Pivot. They represent "ceilings" where the price may struggle to move higher. These are calculated using specific mathematical proportions (0.382, 0.618, and 1.000) to identify high-probability turning points.
- Support Levels (S1, S2, S3): These are projected below the Pivot. They represent "floors" where the price may find buyers and bounce back up. Like the resistance levels, these use the same mathematical proportions to mark significant zones of interest.
Visual Output on Your Chart
The script automatically draws these levels on your screen so you don't have to calculate them manually:
- Lines: It creates horizontal lines across your chart representing the different price zones.
- Labels: It places clear text labels (e.g., "Resistance 1", "Support 2") next to the lines, making it easy to identify which level is which at a glance.
- Style Differentiation: The script uses different line styles (solid, dotted, and dash-dotted) to help visually distinguish between the primary pivot, the immediate support/resistance levels, and the extended outer zones.
Summary for the Trader
In essence, this tool takes the "history" of yesterday's market movement and translates it into a "map" for today. By highlighting these specific Support and Resistance zones, it allows you to see where the market is mathematically likely to face pressure or find stability, assisting in more informed entry and exit decisions.
//+------------------------------------------------------------------+
//|                                                   FiboPiv_v1.mq4 |
//|                                                          Kalenzo |
//|                                      bartlomiej.gorski@gmail.com |
//+------------------------------------------------------------------+
#property copyright "Kalenzo"
#property link      "bartlomiej.gorski@gmail.com"
extern color Resistance_3 = Aqua;
extern color Resistance_2 = Aqua;
extern color Resistance_1 = Aqua;
extern color Piviot = Yellow;
extern color Support_1 = Red;
extern color Support_2 = Red;
extern color Support_3 = Red;
#property indicator_chart_window
//+------------------------------------------------------------------+
//| Custom indicator initialization function                         |
//+------------------------------------------------------------------+
int init()
  {
//---- indicators
//----
   return(0);
  }
//+------------------------------------------------------------------+
//| Custom indicator deinitialization function                       |
//+------------------------------------------------------------------+
int deinit()
  {
//----
   ObjectDelete("S1");
   ObjectDelete("S2");
   ObjectDelete("S3");
   ObjectDelete("R1");
   ObjectDelete("R2");
   ObjectDelete("R3");
   ObjectDelete("PIVIOT");
   ObjectDelete("Support 1");
   ObjectDelete("Support 2");
   ObjectDelete("Support 3");
   ObjectDelete("Piviot level");
   ObjectDelete("Resistance 1");
   ObjectDelete("Resistance 2");
   ObjectDelete("Resistance 3");
   Comment(" ");
//----
   return(0);
  }
//+------------------------------------------------------------------+
//| Custom indicator iteration function                              |
//+------------------------------------------------------------------+
int start()
  {

//----
double rates[1][6],yesterday_close,yesterday_high,yesterday_low;
ArrayCopyRates(rates, Symbol(), PERIOD_D1);

if(DayOfWeek() == 1)
{
   if(TimeDayOfWeek(iTime(Symbol(),PERIOD_D1,1)) == 5)
   {
       yesterday_close = rates[1][4];
       yesterday_high = rates[1][3];
       yesterday_low = rates[1][2];
   }
   else
   {
      for(int d = 5;d>=0;d--)
      {
         if(TimeDayOfWeek(iTime(Symbol(),PERIOD_D1,d)) == 5)
         {
             yesterday_close = rates[d][4];
             yesterday_high = rates[d][3];
             yesterday_low = rates[d][2];
         }

      }

   }
}
else
{
    yesterday_close = rates[1][4];
    yesterday_high = rates[1][3];
    yesterday_low = rates[1][2];
}


//---- Calculate Pivots

Comment("\nYesterday quotations:\nH ",yesterday_high,"\nL ",yesterday_low, "\nC ",yesterday_close);
double R = yesterday_high - yesterday_low;//range
double p = (yesterday_high + yesterday_low + yesterday_close)/3;// Standard Pivot
double r3 = p + (R * 1.000);
double r2 = p + (R * 0.618);
double r1 = p + (R * 0.382);
double s1 = p - (R * 0.382);
double s2 = p - (R * 0.618);
double s3 = p - (R * 1.000);

drawLine(r3,"R3", Resistance_3,1);
drawLabel("Resistance 3",r3,Resistance_3);
drawLine(r2,"R2", Resistance_2,2);
drawLabel("Resistance 2",r2,Resistance_2);
drawLine(r1,"R1", Resistance_1,0);
drawLabel("Resistance 1",r1,Resistance_1);

drawLine(p,"PIVIOT",Piviot,1);
drawLabel("Piviot level",p,Piviot);

drawLine(s1,"S1",Support_1,0);
drawLabel("Support 1",s1,Support_1);
drawLine(s2,"S2",Support_2,2);
drawLabel("Support 2",s2,Support_2);
drawLine(s3,"S3",Support_3,1);
drawLabel("Support 3",s3,Support_3);


//----
   return(0);
  }
//+------------------------------------------------------------------+
void drawLabel(string name,double lvl,color Color)
{
    if(ObjectFind(name) != 0)
    {
        ObjectCreate(name, OBJ_TEXT, 0, Time[10], lvl);
        ObjectSetText(name, name, 8, "Arial", EMPTY);
        ObjectSet(name, OBJPROP_COLOR, Color);
    }
    else
    {
        ObjectMove(name, 0, Time[10], lvl);
    }
}


void drawLine(double lvl,string name, color Col,int type)
{
         if(ObjectFind(name) != 0)
         {
            ObjectCreate(name, OBJ_HLINE, 0, Time[0], lvl,Time[0],lvl);

            if(type == 1)
            ObjectSet(name, OBJPROP_STYLE, STYLE_SOLID);
            else if(type == 2)
            ObjectSet(name, OBJPROP_STYLE, STYLE_DASHDOTDOT);
            else
            ObjectSet(name, OBJPROP_STYLE, STYLE_DOT);

            ObjectSet(name, OBJPROP_COLOR, Col);
            ObjectSet(name,OBJPROP_WIDTH,1);

         }
         else
         {
            ObjectDelete(name);
            ObjectCreate(name, OBJ_HLINE, 0, Time[0], lvl,Time[0],lvl);

            if(type == 1)
            ObjectSet(name, OBJPROP_STYLE, STYLE_SOLID);
            else if(type == 2)
            ObjectSet(name, OBJPROP_STYLE, STYLE_DASHDOTDOT);
            else
            ObjectSet(name, OBJPROP_STYLE, STYLE_DOT);

            ObjectSet(name, OBJPROP_COLOR, Col);
            ObjectSet(name,OBJPROP_WIDTH,1);

         }
}
Comments