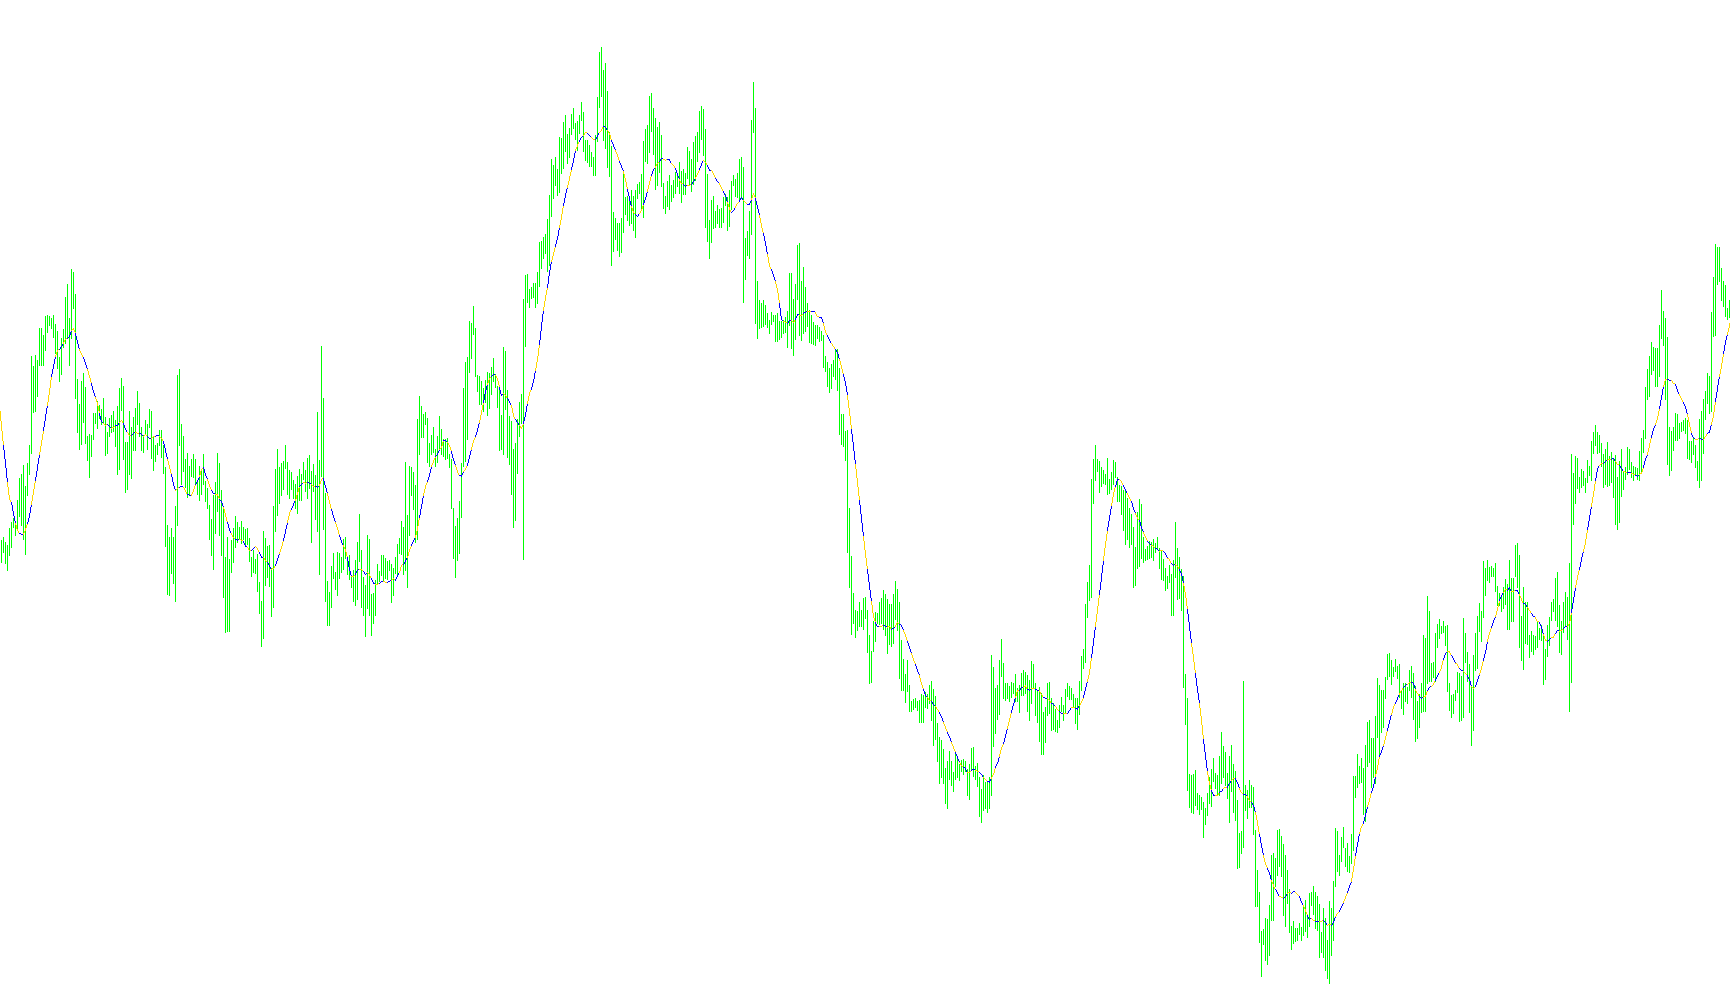
This script is a specialized visual trading tool designed to help identify specific trends and patterns on a price chart. Rather than just showing a standard moving average line, it employs a unique logic to highlight "breaks" or significant shifts in momentum.
Core Functionality
The indicator works by processing market data through a Moving Average, which is a calculation used to smooth out short-term price fluctuations to reveal the underlying trend. You can customize this foundation by choosing the timeframe (period), the calculation type (such as Simple or Exponential), and the specific price point (like the closing price or the high/low of a candle) that the tool should follow.
The "Smart" Logic
The unique behavior of this script lies in how it displays information on your screen. It uses two distinct layers of logic to create a specific visual effect:
- Trend Tracking: The script constantly calculates the current moving average based on your preferences. This provides the base data for the indicator.
- The Discontinuity Filter: Instead of drawing a continuous, unbroken line across the entire chart, the script looks at the recent history of the moving average. It checks the previous three positions of the moving average to see if they contain valid data.
- If the data is continuous, it draws the moving average line normally.
- If the script detects a specific pattern where the data becomes "empty" or disconnected in the sequence, it intentionally breaks the line.
Visual Result
For the user, this means that instead of seeing one long, messy line, the indicator creates distinct, separated segments. This visual "breaking" of the line is intended to help traders pinpoint specific zones where a trend might be shifting or where a new price action cycle is beginning. By isolating these segments, it allows for a cleaner interpretation of the market's movement, making it easier to see where one trend ends and another potentially begins.
//+------------------------------------------------------------------+
//|                                                  MAÂÏÿòíûøêó.mq4 |
//|                                                                * |
//|Integer                                                         * |
//+------------------------------------------------------------------+
#property copyright "*"
#property link      "*"

#property indicator_chart_window
#property indicator_buffers 2
#property indicator_color1 CLR_NONE
#property indicator_color2 Yellow
//---- input parameters
extern int MAPeriod=14;
extern int MAMethod=0; // 0-SMA, 1-EMA, 2-SMMA, 3-LWMA
extern int MAPrice=0; // 0-Close, 1-Open, 2-High, 3-Low, 4-Median, 5-Typical, 6-Weighted

#property indicator_width1 3
#property indicator_width2 3


//---- buffers
double ExtMapBuffer1[];
double ExtMapBuffer2[];
//+------------------------------------------------------------------+
//| Custom indicator initialization function                         |
//+------------------------------------------------------------------+
int init()
  {
//---- indicators
   SetIndexStyle(0,DRAW_LINE);
   SetIndexBuffer(0,ExtMapBuffer1);
   SetIndexBuffer(1,ExtMapBuffer2);

//----
   return(0);
  }
//+------------------------------------------------------------------+
//| Custom indicator deinitialization function                       |
//+------------------------------------------------------------------+
int deinit()
  {
//----

//----
   return(0);
  }
//+------------------------------------------------------------------+
//| Custom indicator iteration function                              |
//+------------------------------------------------------------------+
int start()
  {
         int limit=Bars-IndicatorCounted();

            for(int i=limit-1;i>=0;i--){
               ExtMapBuffer1[i]=iMA(NULL,0,MAPeriod,0,MAMethod,MAPrice,i);
               if(   ExtMapBuffer2[i+1]!=EMPTY_VALUE &&
                     ExtMapBuffer2[i+2]!=EMPTY_VALUE &&
                     ExtMapBuffer2[i+3]!=EMPTY_VALUE   )
                  {
                     ExtMapBuffer2[i]=EMPTY_VALUE;
                  }
                  else{
                     ExtMapBuffer2[i]=ExtMapBuffer1[i];
                  }

            }
   return(0);
  }
//+------------------------------------------------------------------+
Comments