_T_S_R__Signal_LineVS
Download script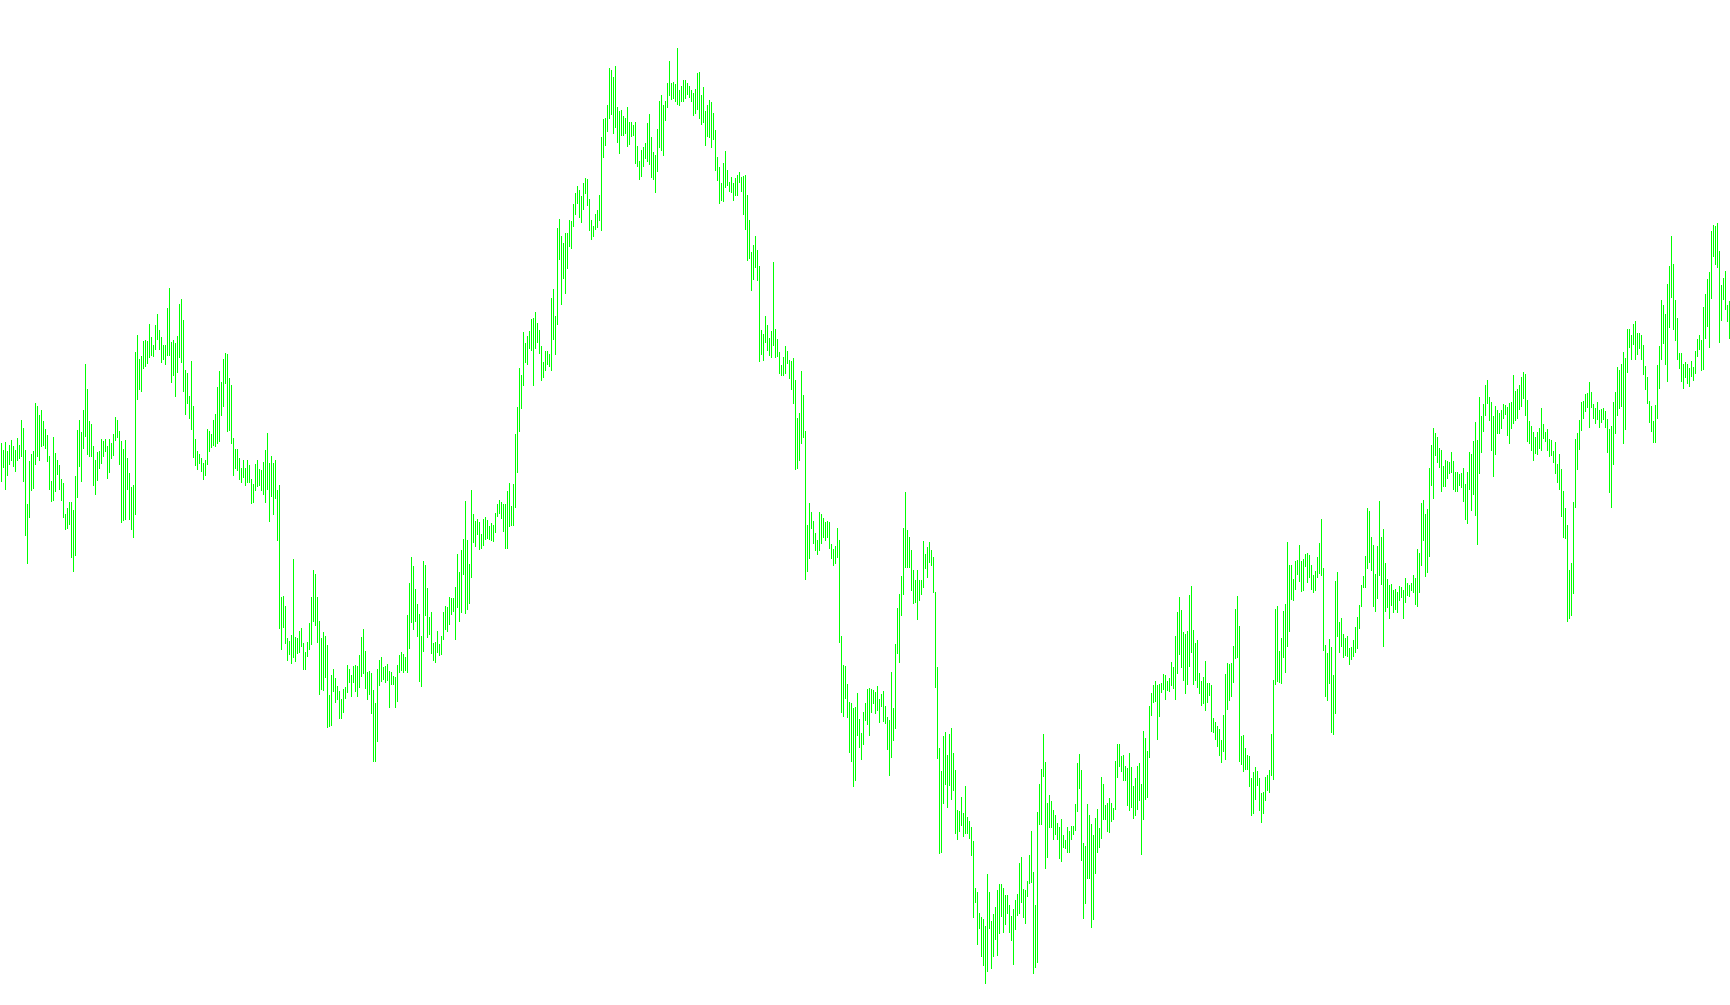
This tool is designed to analyze market trends by identifying and visualizing the direction of price movements. Rather than simply looking at raw price action, it processes historical data through several mathematical layers to smooth out "noise" and highlight the underlying momentum.
Core Methodology
The logic operates in three distinct stages:
1. Data Smoothing and Synthesis The script begins by calculating specific weighted moving averages based on the user-defined period. It then applies a unique calculation where it doubles a shorter-term average and subtracts a longer-term average. This mathematical relationship is designed to emphasize changes in momentum, making the trend more visible than a standard moving average would allow.
2. Mapping the Trend Line Once the initial data is processed, the script creates a "Map." It takes the results of the previous calculation and applies an additional smoothing pass (using a square-root factor of your chosen period). This results in a refined signal line that represents the current trajectory of the market. A "Vertical Shift" is also applied to ensure this line sits clearly on your chart at a readable position.
3. Trend Identification and Visualization The final stage of the logic is the classification of the trend into two categories:
- Uptrend: When the signal map is moving higher than its previous point, the script identifies this as an upward move. It highlights these points using a specific color (Blue) to indicate bullish momentum.
- Downtrend: When the signal map moves lower than its previous point, the script identifies this as a downward move, highlighting these points in a different color (Red) to indicate bearish momentum.
How to Interpret the Results
The tool provides a visual distinction between "Up" and "Down" states. By watching how the colored dots transition from one state to another, you can see exactly where the script detects a shift in market direction. It is specifically designed to filter out minor price fluctuations, focusing instead on the sustained slope of the market trend.
//+------------------------------------------------------------------+
//| HMA.mq4
//| Copyright © 2006 WizardSerg <wizardserg@mail.ru>, ?? ??????? ForexMagazine #104
//| wizardserg@mail.ru
//| Revised by IgorAD,igorad2003@yahoo.co.uk |
//| Personalized by iGoR AKA FXiGoR for the Trend Slope Trading method (T_S_T)
//| Link:
//| contact: thefuturemaster@hotmail.com
//+------------------------------------------------------------------+
#property copyright "MT4 release WizardSerg <wizardserg@mail.ru>, ?? ??????? ForexMagazine #104"
#property link      "wizardserg@mail.ru"

#property indicator_chart_window
#property indicator_buffers 2
#property indicator_color1 Blue
#property indicator_color2 Red
//---- input parameters
extern int       period=50;
extern int       method=3;                         // MODE_SMA
extern int       price=0;                          // PRICE_CLOSE
extern int       verticalShift=20;
//---- buffers
double Uptrend[];
double Dntrend[];
double ExtMapBuffer[];


//+------------------------------------------------------------------+
//| Custom indicator initialization function                         |
//+------------------------------------------------------------------+
int init()
{
    IndicatorBuffers(3);
    SetIndexBuffer(0, Uptrend);
    //ArraySetAsSeries(Uptrend, true);
    SetIndexBuffer(1, Dntrend);
    //ArraySetAsSeries(Dntrend, true);
    SetIndexBuffer(2, ExtMapBuffer);
    ArraySetAsSeries(ExtMapBuffer, true);

    SetIndexStyle(0,DRAW_LINE,STYLE_DOT,1);
    SetIndexStyle(1,DRAW_LINE,STYLE_DOT,1);

    IndicatorShortName("Signal Line("+period+")");
    return(0);
}

//+------------------------------------------------------------------+
//| Custor indicator deinitialization function                       |
//+------------------------------------------------------------------+
int deinit()
{
    // ???? ????? ?????? ??????
    return(0);
}

//+------------------------------------------------------------------+
//| ?????????? ???????                                               |
//+------------------------------------------------------------------+
double WMA(int x, int p)
{
    return(iMA(NULL, 0, p, 0, method, price, x)+verticalShift*Point);
}

//+------------------------------------------------------------------+
//| Custom indicator iteration function                              |
//+------------------------------------------------------------------+
int start()
{
    int counted_bars = IndicatorCounted();

    if(counted_bars < 0)
        return(-1);

    int x = 0;
    int p = MathSqrt(period);
    int e = Bars - counted_bars + period + 1;

    double vect[], trend[];

    if(e > Bars)
        e = Bars;

    ArrayResize(vect, e);
    ArraySetAsSeries(vect, true);
    ArrayResize(trend, e);
    ArraySetAsSeries(trend, true);

    for(x = 0; x < e; x++)
    {
        vect[x] = 2*WMA(x, period/2) - WMA(x, period)+verticalShift*Point;
 //       Print("Bar date/time: ", TimeToStr(Time[x]), " close: ", Close[x], " vect[", x, "] = ", vect[x], " 2*WMA(p/2) = ", 2*WMA(x, period/2), " WMA(p) = ",  WMA(x, period));
    }

    for(x = 0; x < e-period; x++)

        ExtMapBuffer[x] = iMAOnArray(vect, 0, p, 0, method, x)+verticalShift*Point;

    for(x = e-period; x >= 0; x--)
    {
        trend[x] = trend[x+1];
        if (ExtMapBuffer[x]> ExtMapBuffer[x+1]) trend[x] =1;
        if (ExtMapBuffer[x]< ExtMapBuffer[x+1]) trend[x] =-1;

    if (trend[x]>0)
    { Uptrend[x] = ExtMapBuffer[x];
      if (trend[x+1]<0) Uptrend[x+1]=ExtMapBuffer[x+1];
      Dntrend[x] = EMPTY_VALUE;
    }
    else
    if (trend[x]<0)
    {
      Dntrend[x] = ExtMapBuffer[x];
      if (trend[x+1]>0) Dntrend[x+1]=ExtMapBuffer[x+1];
      Uptrend[x] = EMPTY_VALUE;
    }

    //Comment( " trend=",trend[x]);
    //Comment("Down: ",Dntrend[x], "  Up: ",Uptrend[x]);
    }

    return(0);
}
//+------------------------------------------------------------------+
Comments