_Slope Direction Line
Download script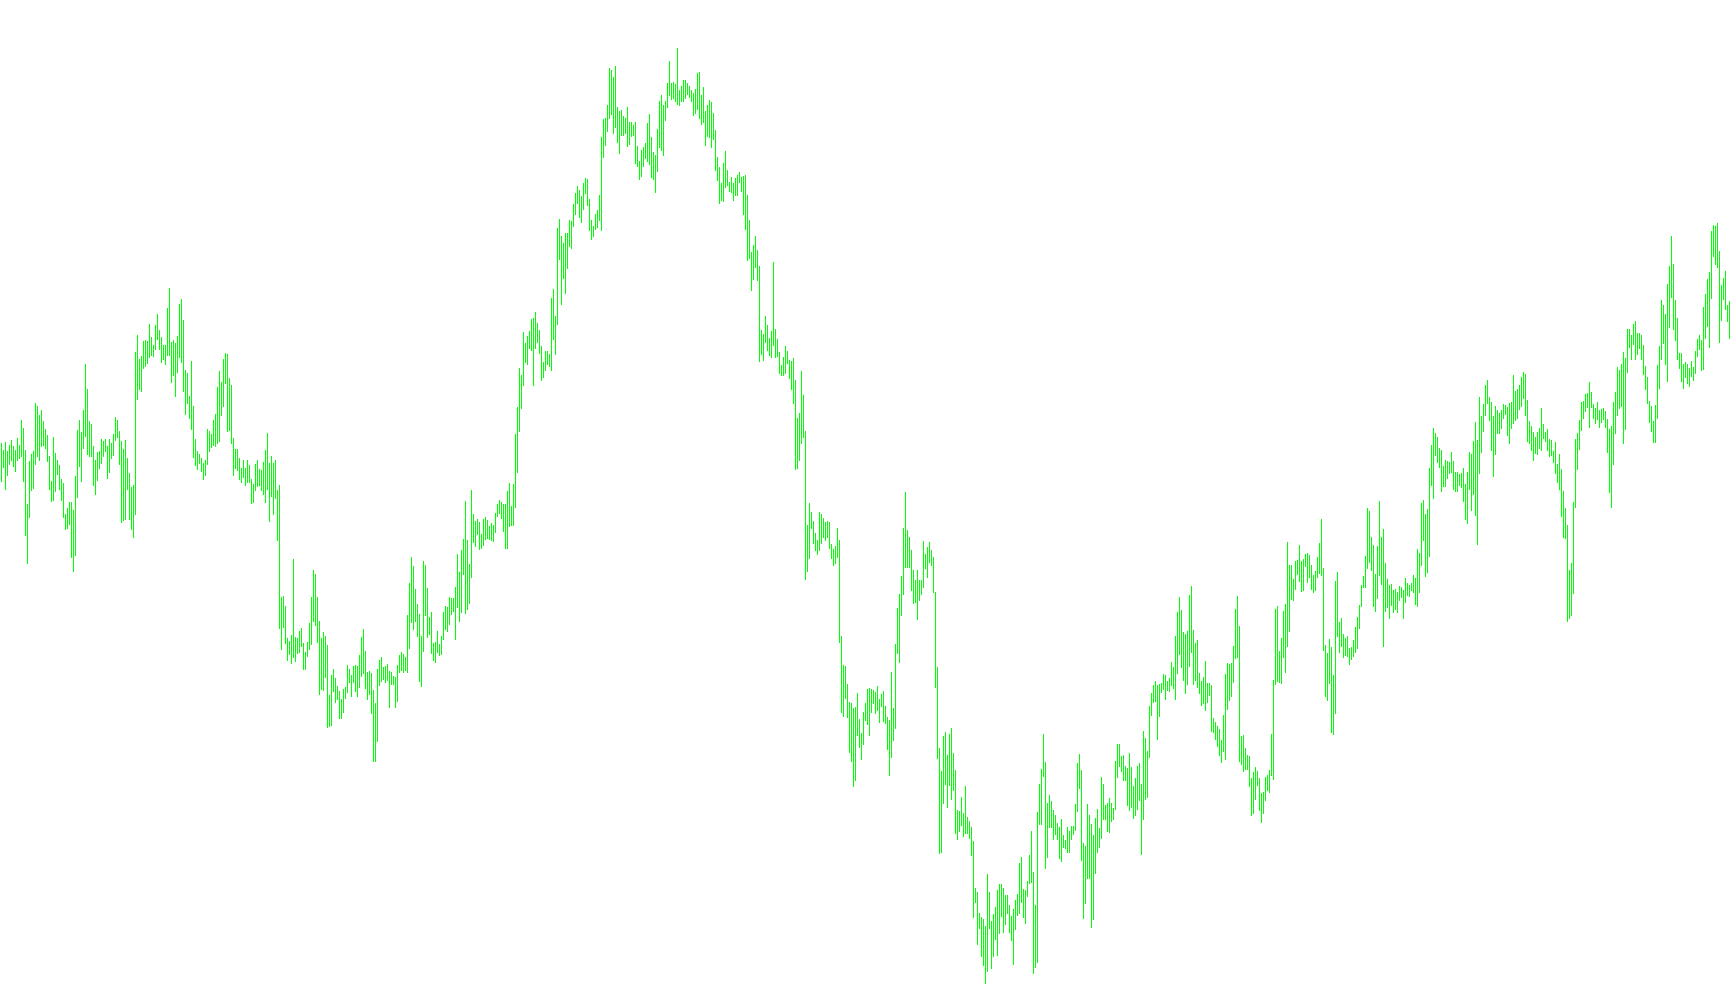
This tool is designed to help traders visualize and identify market trends by calculating the specific direction and slope of price movements. Instead of just showing a simple moving average, it uses a more sophisticated mathematical approach to filter out "market noise" and highlight sustained momentum.
Core Logic & Functionality
1. Trend Smoothing and Vector Calculation The script begins by looking at the price history over a specific timeframe (defined by the user). It applies a weighted calculation that compares two different moving averages. By subtracting one from another, the tool creates a "vector"—essentially a mathematical representation of how much the price is accelerating or decelerating at any given moment.
2. Advanced Filtering Once the vector is established, the script performs a second layer of smoothing. It takes the square root of your chosen period to determine how much to average out those vectors. This process ensures that minor, insignificant price fluctuations don't trigger false signals; only significant, consistent shifts in direction are captured.
3. Dynamic Trend Identification The logic then compares each new data point against the previous one to determine the current trajectory:
- Bullish Movement: If the smoothed value is rising compared to the previous point, the script identifies an upward trend.
- Bearish Movement: If the smoothed value is falling compared to the previous point, the script identifies a downward trend.
Visual Representation on the Chart
The tool communicates these findings through two distinct visual lines:
- Uptrend Line (Light Blue): This line appears specifically during periods where the logic detects positive momentum. It helps traders stay focused on "buy" zones or sustained upward climbs.
- Downtrend Line (Tomato Red): This line activates when the logic detects negative momentum, highlighting "sell" zones or consistent downward slides.
By switching between these two colors, the script provides a clear visual cue of the current market "slope." When the lines switch, it indicates a potential shift in the trend, allowing you to see where the price direction has officially flipped from one state to another.
//+------------------------------------------------------------------+
//| HMA.mq4
//| Copyright © 2006 WizardSerg <wizardserg@mail.ru>, ?? ??????? ForexMagazine #104
//| wizardserg@mail.ru
//| Revised by IgorAD,igorad2003@yahoo.co.uk |
//| Personalized by iGoR AKA FXiGoR for the Trend Slope Trading method (T_S_T)
//| Link:
//| contact: thefuturemaster@hotmail.com
//+------------------------------------------------------------------+
#property copyright "MT4 release WizardSerg <wizardserg@mail.ru>, ?? ??????? ForexMagazine #104"
#property link      "wizardserg@mail.ru"

#property indicator_chart_window
#property indicator_buffers 2
#property indicator_color1 LightBlue
#property indicator_color2 Tomato
//---- input parameters
extern int       period=80;
extern int       method=3;                         // MODE_SMA
extern int       price=0;                          // PRICE_CLOSE
//---- buffers
double Uptrend[];
double Dntrend[];
double ExtMapBuffer[];


//+------------------------------------------------------------------+
//| Custom indicator initialization function                         |
//+------------------------------------------------------------------+
int init()
{
    IndicatorBuffers(3);
    SetIndexBuffer(0, Uptrend);
    //ArraySetAsSeries(Uptrend, true);
    SetIndexBuffer(1, Dntrend);
    //ArraySetAsSeries(Dntrend, true);
    SetIndexBuffer(2, ExtMapBuffer);
    ArraySetAsSeries(ExtMapBuffer, true);

    SetIndexStyle(0,DRAW_LINE,STYLE_SOLID,2);
    SetIndexStyle(1,DRAW_LINE,STYLE_SOLID,2);

    IndicatorShortName("Slope Direction Line("+period+")");
    return(0);
}

//+------------------------------------------------------------------+
//| Custor indicator deinitialization function                       |
//+------------------------------------------------------------------+
int deinit()
{
    // ???? ????? ?????? ??????
    return(0);
}

//+------------------------------------------------------------------+
//| ?????????? ???????                                               |
//+------------------------------------------------------------------+
double WMA(int x, int p)
{
    return(iMA(NULL, 0, p, 0, method, price, x));
}

//+------------------------------------------------------------------+
//| Custom indicator iteration function                              |
//+------------------------------------------------------------------+
int start()
{
    int counted_bars = IndicatorCounted();

    if(counted_bars < 0)
        return(-1);

    int x = 0;
    int p = MathSqrt(period);
    int e = Bars - counted_bars + period + 1;

    double vect[], trend[];

    if(e > Bars)
        e = Bars;

    ArrayResize(vect, e);
    ArraySetAsSeries(vect, true);
    ArrayResize(trend, e);
    ArraySetAsSeries(trend, true);

    for(x = 0; x < e; x++)
    {
        vect[x] = 2*WMA(x, period/2) - WMA(x, period);
 //       Print("Bar date/time: ", TimeToStr(Time[x]), " close: ", Close[x], " vect[", x, "] = ", vect[x], " 2*WMA(p/2) = ", 2*WMA(x, period/2), " WMA(p) = ",  WMA(x, period));
    }

    for(x = 0; x < e-period; x++)

        ExtMapBuffer[x] = iMAOnArray(vect, 0, p, 0, method, x);

    for(x = e-period; x >= 0; x--)
    {
        trend[x] = trend[x+1];
        if (ExtMapBuffer[x]> ExtMapBuffer[x+1]) trend[x] =1;
        if (ExtMapBuffer[x]< ExtMapBuffer[x+1]) trend[x] =-1;

    if (trend[x]>0)
    { Uptrend[x] = ExtMapBuffer[x];
      if (trend[x+1]<0) Uptrend[x+1]=ExtMapBuffer[x+1];
      Dntrend[x] = EMPTY_VALUE;
    }
    else
    if (trend[x]<0)
    {
      Dntrend[x] = ExtMapBuffer[x];
      if (trend[x+1]>0) Dntrend[x+1]=ExtMapBuffer[x+1];
      Uptrend[x] = EMPTY_VALUE;
    }

    Comment( " trend=",trend[x]);
    }

    return(trend[x]);
}
//+------------------------------------------------------------------+
Comments