Stochastic RSI_v1
Download script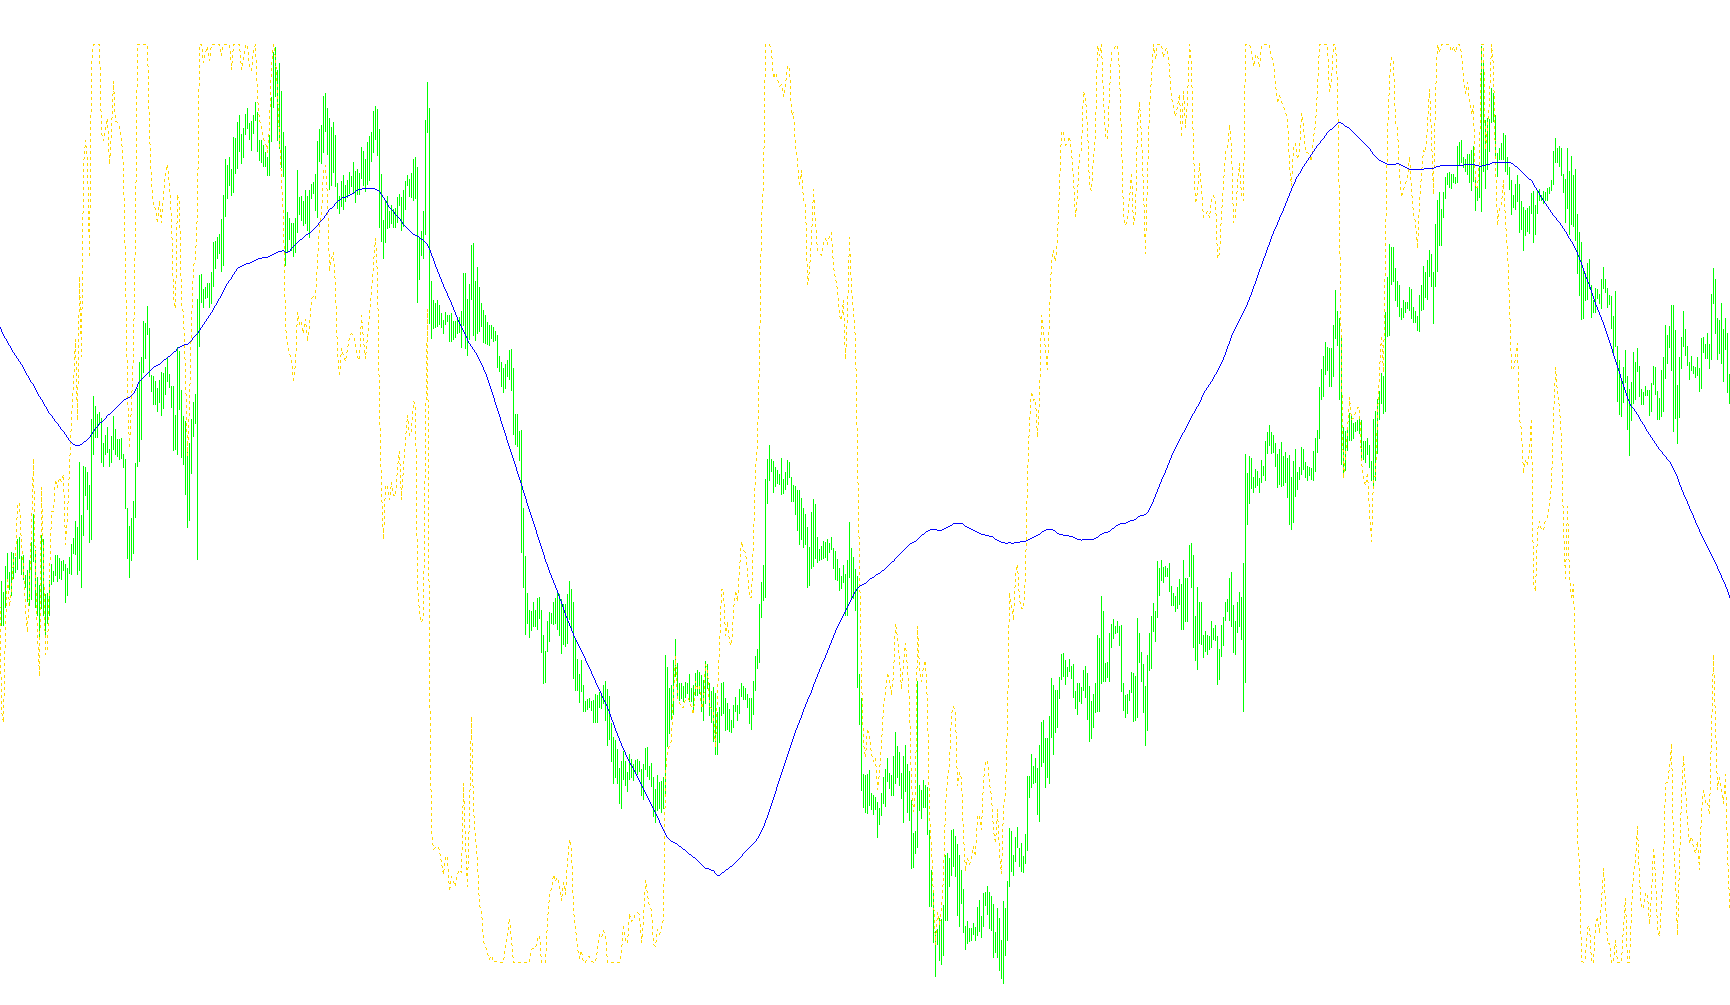
This tool is a specialized technical analysis indicator designed to help traders identify momentum and potential overbought or oversold conditions in the financial markets. It works by combining two well-known trading concepts—the Relative Strength Index (RSI) and the Stochastic Oscillator—into a single visual output.
How the Logic Works
The core purpose of this script is to measure where the current price sits relative to its recent historical range, specifically looking at the "strength" of a trend rather than just the price itself. Here is the step-by-step logic used to generate the data:
1. Analyzing Momentum (The RSI Base) First, the tool looks at the Relative Strength Index (RSI). Instead of looking at raw prices, it calculates the velocity and magnitude of price movements over a specific period. This tells the script whether the market is currently moving with strong upward momentum or downward pressure.
2. Defining the Range (Highest and Lowest) The indicator then scans back through a set amount of historical data to find the highest and lowest RSI values reached during that timeframe. By identifying these boundaries, the tool creates a "window" of recent activity.
3. Calculating the Position (The StochRSI Value) The script compares the current RSI value to that historical window. It calculates what percentage of the way the current price is between the high and the low of that range.
- If the current value is near the top of the range, it suggests the market might be "overbought."
- If it is near the bottom, it suggests it might be "oversold." This result is plotted as a primary line on your chart.
4. Smoothing the Data (The Signal Line) Because raw momentum data can often be jagged or volatile, the tool includes a "Signal" calculation. It takes the average of the previous results over a specific duration to create a secondary, smoother line. This helps traders identify trend changes more clearly; when the primary line crosses the signal line, it is often interpreted as a potential turning point in the market's direction.
Summary for the User
In simple terms, this indicator tells you how "stretched" the current market movement is compared to its recent past. It filters out minor market noise by looking at the relationship between price momentum and historical extremes, providing a visual guide to help you spot potential entries or exits based on trend exhaustion.
//+------------------------------------------------------------------+
//|                                               Stochastic RSI.mq4 |
//|                                                tonyc2a@yahoo.com |
//|                                                                  |
//+------------------------------------------------------------------+
#property copyright "tonyc2a@yahoo.com"
#property link      ""

#property indicator_separate_window
#property indicator_buffers 2
#property indicator_minimum -5
#property indicator_maximum 105
#property indicator_color1 Lime
#property indicator_color2 White

//---- input parameters
extern int RSI_Periods=144;
extern int Percent_K=144;
extern int Percent_D=144;
extern int NumOfBars=0;

//---- buffers
double Buffer1[];
double Buffer2[];

//+------------------------------------------------------------------+
//| Custom indicator initialization function                         |
//+------------------------------------------------------------------+
int init()
  {
//---- indicators
   SetIndexStyle(0,DRAW_LINE,STYLE_DOT);
   SetIndexBuffer(0,Buffer1);
   SetIndexLabel(0,"StochRSI");
   SetIndexStyle(1,DRAW_LINE,STYLE_SOLID,1);
   SetIndexBuffer(1,Buffer2);
   SetIndexLabel(1,"Signal");

//----
   return(0);
  }
//+------------------------------------------------------------------+
//| Custor indicator deinitialization function                       |
//+------------------------------------------------------------------+
int deinit()
  {
//---- TODO: add your code here

//----
   return(0);
  }
//+------------------------------------------------------------------+
//| Custom indicator iteration function                              |
//+------------------------------------------------------------------+
int start()
  {
   int    counted_bars=IndicatorCounted();
   double Current_RSI,Lowest_RSI,Highest_RSI,sum_K;
//---- TODO: add your code here
   if(NumOfBars==0)NumOfBars=Bars;
   for(int i=NumOfBars-MathMax(RSI_Periods,Percent_K)-1;i>=0;i--){
      Current_RSI=iRSI(NULL,0,RSI_Periods,PRICE_TYPICAL,i);
      Highest_RSI=Current_RSI;
      Lowest_RSI=Current_RSI;

      for(int x=0;x<=Percent_K;x++){
         Lowest_RSI=MathMin(Lowest_RSI,iRSI(NULL,0,RSI_Periods,PRICE_TYPICAL,i+x));
         Highest_RSI=MathMax(Highest_RSI,iRSI(NULL,0,RSI_Periods,PRICE_TYPICAL,i+x));
         }

      sum_K=0;
      for(x=0;x<=Percent_D;x++) sum_K=sum_K+Buffer1[i+x];

      Buffer1[i]=((Current_RSI-Lowest_RSI)/(Highest_RSI-Lowest_RSI))*100;
      Buffer2[i]=sum_K/Percent_D;
      }
//----
   return(0);
  }
//+------------------------------------------------------------------+
Comments