SSRC
Download script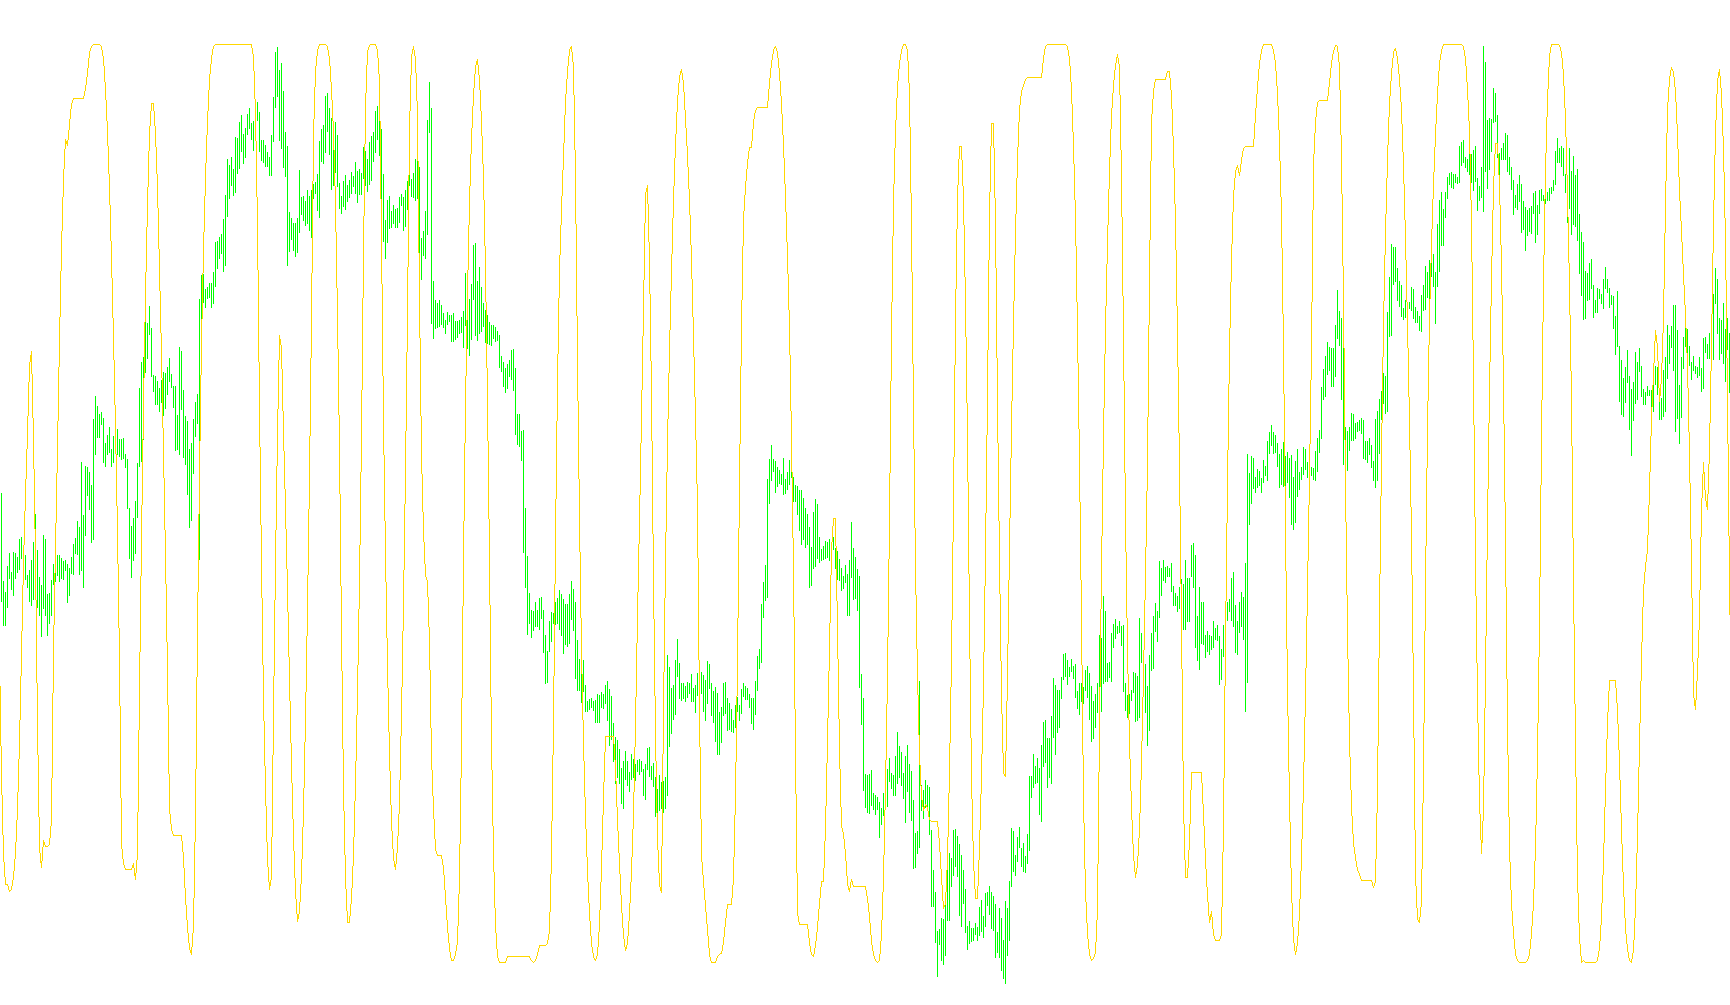
The logic behind this script focuses on identifying market trends and price momentum by analyzing the relationship between price movements and their rankings over a specific period. Rather than looking at simple price changes, it employs advanced statistical methods to determine how consistently the market is moving in a particular direction.
Core Components of the Logic:
1. Data Smoothing and Weighted Averaging (The "Snake" Mechanism) Before any analysis happens, the script cleans the raw market noise. It creates a base movement by taking a specific price point (such as the Close, High, or Low) and applying a weighted moving average. It uses a "Snake" logic, which assigns different weights to prices based on their distance from the current point. This helps ensure that the most recent data has a significant influence while still considering the immediate historical context to create a smoother, more reliable trend line.
2. Trend Filtering (Martingale Smoothing) The script then takes this smoothed trend and processes it through a secondary filter. It identifies the highest and lowest values over a set period and uses them to calculate a "smoothed" version of the trend. This step is designed to eliminate sudden, erratic spikes or "fake-outs," ensuring that the final output reflects a stable market direction rather than momentary volatility.
3. Spearman Rank Correlation (The Statistical Engine) This is the primary analytical core of the script. Instead of measuring how much the price changed (magnitude), it measures the order in which prices appear (rank).
- It takes a window of recent data and ranks the prices from highest to lowest.
- It then compares this sequence to a perfectly linear progression.
- If the market is moving in a consistent, steady trend, the "rank" of the prices will align closely with their chronological order, resulting in a high correlation score.
4. Final Output and Normalization The final result is a numerical value that represents the strength of the current trend based on its statistical consistency. To make this easy for a user to read:
- The script converts the correlation into a bounded scale.
- It caps the results so they stay within a specific range (typically between -1.0 and 1.0).
- High positive values indicate a strong, consistent upward trend; high negative values indicate a strong, consistent downward trend; and values near zero suggest a lack of clear direction or a sideways market.
Summary of Workflow
In simple terms, the script:
- Smooths the raw price data to remove noise.
- Filters that data to highlight the primary trend.
- Ranks those values to see how consistently they are ordered over time.
- Displays a final score showing whether the current market move is statistically "reliable" or just random noise.
//+------------+-----------------------------------------------------+
//| v.12.04.07 |                                            SSRC.mq4 |
//+------------+              Spearman,                              |
//|            |              Rosh                                   |
//|            |              È ïðèìàçàâøèéñÿ ê íèì                  |
//|            |              Bookkeeper, 2007, yuzefovich@gmail.com |
//+------------+-----------------------------------------------------+
// http://www.improvedoutcomes.com/docs/WebSiteDocs/Clustering/
// Clustering_Parameters/Spearman_Rank_Correlation_Distance_Metric.htm
// http://www.infamed.com/stat/s05.html
// http://www.metaquotes.net
// http://codebase.mql4.com/ru/1023
#property copyright ""
#property link      "http://www.forexter.land.ru/indicators.htm"
//----
#property indicator_separate_window
#property indicator_maximum  1.3
#property indicator_minimum -1.3
#property indicator_level1   0.9
#property indicator_level2  -0.9
#property indicator_level3   0.8
#property indicator_level4  -0.8
#property indicator_level5   0.7
#property indicator_level6  -0.7
#property indicator_levelcolor DimGray
#property indicator_buffers  1
#property indicator_color1   Maroon
//---- input parameters
//---- Snake
extern int    SnakeRange   =3;
extern int    FilterPeriod =21;
extern double MartFiltr    =2;
extern int    PriceConst   =0; // 0 - Close
                               // 1 - Open
                               // 2 - High
                               // 3 - Low
                               // 4 - (H+L)/2
                               // 5 - (H+L+C)/3
                               // 6 - (H+L+2*C)/4
//---- buffers
double SRCBuffer[];
double Axis[];
double Mart[];
//---- SpearmanRankCorrelation
int    rangeN = 14; //   = 30 maximum
double R2[];
double multiply;
int    PriceInt[];
int    SortInt[];
//+------------------------------------------------------------------+
void MartAxis(int Pos) { int SnakeWeight,i,w,ww,Shift;double SnakeSum;
switch(PriceConst) {
case  0:
  Axis[Pos]=iMA(NULL,0,SnakeRange+1,0,MODE_LWMA,PRICE_CLOSE,Pos);
  break;
case  1:
  Axis[Pos]=iMA(NULL,0,SnakeRange+1,0,MODE_LWMA,PRICE_OPEN,Pos);
  break;
case  2:
  Axis[Pos]=iMA(NULL,0,SnakeRange+1,0,MODE_LWMA,PRICE_HIGH,Pos);
  break;
case  3:
  Axis[Pos]=iMA(NULL,0,SnakeRange+1,0,MODE_LWMA,PRICE_LOW,Pos);
  break;
case  4:
  Axis[Pos]=iMA(NULL,0,SnakeRange+1,0,MODE_LWMA,PRICE_MEDIAN,Pos);
  break;
case  5:
  Axis[Pos]=iMA(NULL,0,SnakeRange+1,0,MODE_LWMA,PRICE_TYPICAL,Pos);
  break;
case  6:
  Axis[Pos]=iMA(NULL,0,SnakeRange+1,0,MODE_LWMA,PRICE_WEIGHTED,Pos);
  break;
default:
  Axis[Pos]=iMA(NULL,0,SnakeRange+1,0,MODE_LWMA,PRICE_WEIGHTED,Pos);
  break; }
for(Shift=Pos+SnakeRange+2;Shift>Pos;Shift--) { SnakeSum=0.0;
SnakeWeight=0; i=0; w=Shift+SnakeRange; ww=Shift-SnakeRange;
if(ww<Pos) ww=Pos;
while(w>=Shift) { i++; SnakeSum=SnakeSum+i*SnakePrice(w);
SnakeWeight=SnakeWeight+i; w--; }
while(w>=ww) { i--; SnakeSum=SnakeSum+i*SnakePrice(w);
SnakeWeight=SnakeWeight+i; w--; }
Axis[Shift]=SnakeSum/SnakeWeight; } return; }
//----
double SnakePrice(int Shift) {
switch(PriceConst) {
   case  0: return(Close[Shift]);
   case  1: return(Open[Shift]);
   case  2: return(High[Shift]);
   case  3: return(Low[Shift]);
   case  4: return((High[Shift]+Low[Shift])/2);
   case  5: return((Close[Shift]+High[Shift]+Low[Shift])/3);
   case  6: return((2*Close[Shift]+High[Shift]+Low[Shift])/4);
   default: return(Close[Shift]); } }
//+------------------------------------------------------------------+
void SmoothOverMart(int Shift) { double t,b;
t=Axis[ArrayMaximum(Axis,FilterPeriod,Shift)];
b=Axis[ArrayMinimum(Axis,FilterPeriod,Shift)];
Mart[Shift]=(2*(2+MartFiltr)*Axis[Shift]-(t+b))/2/(1+MartFiltr);
return; }
//+------------------------------------------------------------------+
double SpearmanRankCorrelation(double Ranks[], int N) { double res,z2;
for(int i=0;i<N;i++) { z2 += MathPow(Ranks[i] - i - 1, 2); }
res=1-6*z2/(MathPow(N,3)-N); return(res); }
//+------------------------------------------------------------------+
void RankPrices(int InitialArray[]) { double dcounter, averageRank;
int i, k, m, dublicat, counter, etalon; double TrueRanks[];
ArrayResize(TrueRanks, rangeN); ArrayCopy(SortInt, InitialArray);
for(i=0;i<rangeN;i++) TrueRanks[i]=i+1;
ArraySort(SortInt, 0, 0, MODE_DESCEND);
for(i=0;i<rangeN-1;i++) { if(SortInt[i]!=SortInt[i+1]) continue;
dublicat=SortInt[i]; k=i+1; counter=1; averageRank=i+1;
while(k<rangeN) { if(SortInt[k]==dublicat) {
counter++; averageRank+=k+1; k++; } else break; }
dcounter=counter; averageRank=averageRank/dcounter;
for(m=i;m<k;m++) TrueRanks[m]=averageRank; i=k; }
for(i=0;i<rangeN;i++) { etalon=InitialArray[i]; k=0;
while(k<rangeN) { if(etalon==SortInt[k]) {
R2[i]=TrueRanks[k]; break; } k++; } } return; }
//+------------------------------------------------------------------+
int init() { IndicatorBuffers(3);
SetIndexBuffer(0,SRCBuffer); SetIndexStyle(0,DRAW_LINE);
SetIndexBuffer(1,Axis); SetIndexStyle(1,DRAW_NONE);
SetIndexBuffer(2,Mart); SetIndexStyle(2,DRAW_NONE);
ArrayResize(R2,rangeN); ArrayResize(PriceInt,rangeN);
ArrayResize(SortInt,rangeN);
if(rangeN>30) IndicatorShortName("Decrease rangeN input!");
else
IndicatorShortName("SSRC( SR:"+SnakeRange+", FP:"+FilterPeriod+" )");
multiply=MathPow(10,Digits); return(0); }
//+------------------------------------------------------------------+
int deinit() { return(0); }
//+------------------------------------------------------------------+
int start() { int i,k,limit,limit2,limit3;
int counted_bars=IndicatorCounted(); if(rangeN>30) return(-1);
if(counted_bars==0) {
limit=Bars-(rangeN+FilterPeriod+SnakeRange+4);
limit2=Bars-(SnakeRange+2);
limit3=Bars-(FilterPeriod+SnakeRange+3); }
if(counted_bars>0) {
limit=Bars-counted_bars+1; limit2=limit; limit3=limit; }
for(i=limit2;i>=0;i--) MartAxis(i);
for(i=limit3;i>=0;i--) SmoothOverMart(i);
for(i=limit;i>=0;i--) {
for(k=0;k<rangeN;k++) PriceInt[k]=Mart[i+k]*multiply;
RankPrices(PriceInt); SRCBuffer[i]=SpearmanRankCorrelation(R2,rangeN);
if(SRCBuffer[i]>1.0) SRCBuffer[i]=1.0;
if(SRCBuffer[i]<-1.0) SRCBuffer[i]=-1.0; } return(0); }
//+------------------------------------------------------------------+
Comments