HTID
Download script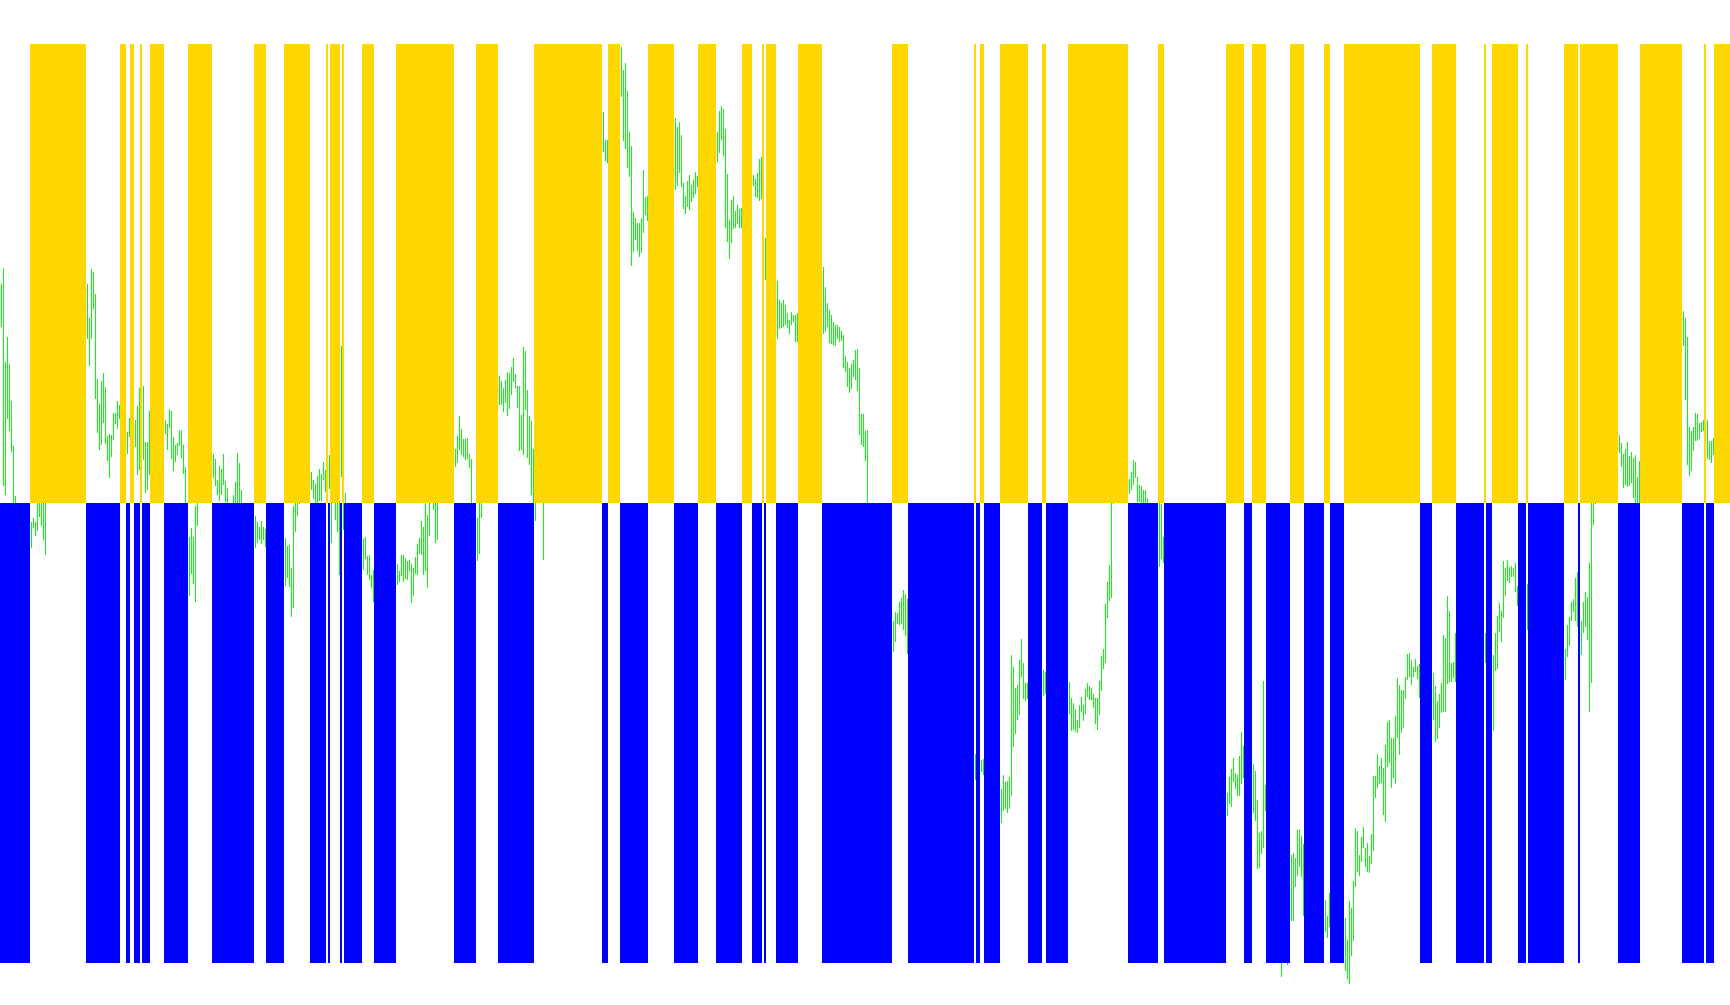
This technical tool is designed to act as a visual momentum and trend indicator, providing traders with a clear distinction between upward and downward price movements based on historical price extremes.
How the Logic Works
The script functions by analyzing specific "look-back" periods of price action to identify key structural levels. Here is a breakdown of the process:
1. Identifying Price Extremes The tool scans a set number of previous candles (the look-back period) to find the highest high and the lowest low reached within that timeframe. By identifying these two points, the script establishes the "trading range" for that specific period.
2. Calculating Dynamic Thresholds Instead of simply looking at the highest or lowest price, the logic calculates a specific mathematical pivot point. It determines a value based on the distance between the high and low prices. Specifically, it identifies a level that sits approximately 50.6% away from the top of that range. This acts as a "fair value" or "equilibrium" marker within the recent price movement.
3. Trend Detection and Visualization The core purpose of the script is to compare these calculated values against each other across time:
- Bullish Signal: When the calculated value from one period is higher than the previous one, the indicator recognizes a shift toward upward momentum. This is visualized as a positive bar (Blue).
- Bearish Signal: When the calculated value drops below the previous period's level, it signals a downward shift in momentum. This is visualized as a negative bar (Red).
Summary for the Trader
Rather than cluttering your main chart with lines, this indicator creates a separate visual window. It filters out market "noise" by focusing on significant high/low peaks and provides you with a color-coded histogram. This allows you to quickly see whether the prevailing trend is moving higher or lower based on where price is currently sitting relative to its recent historical range.
#property indicator_separate_window
#property indicator_buffers 2
#property indicator_color1 Blue
#property indicator_color2 Red

int gi_76 = 7;
double gd_80 = 50.6;
int g_bars_88 = 1500;
double g_ibuf_92[];
double g_ibuf_96[];
double g_ibuf_100[];
double g_ibuf_104[];

int init() {
   IndicatorBuffers(4);
   SetIndexStyle(0, DRAW_HISTOGRAM, STYLE_SOLID, 3);
   SetIndexBuffer(0, g_ibuf_100);
   SetIndexStyle(1, DRAW_HISTOGRAM, STYLE_SOLID, 3);
   SetIndexBuffer(1, g_ibuf_104);
   SetIndexBuffer(2, g_ibuf_92);
   SetIndexBuffer(3, g_ibuf_96);
   IndicatorShortName("HTID (" + gi_76 + ")");
   return (0);
}

int deinit() {
   return (0);
}

int start() {
   double ld_8;
   double ld_16;
   double ld_32;
   if (g_bars_88 >= Bars) g_bars_88 = Bars;
   SetIndexDrawBegin(0, Bars - g_bars_88 + gi_76);
   SetIndexDrawBegin(1, Bars - g_bars_88 + gi_76);
   int l_ind_counted_4 = IndicatorCounted();
   if (Bars <= gi_76 + 1) return (0);
   if (l_ind_counted_4 < gi_76 + 1) {
      for (int li_0 = 1; li_0 <= gi_76; li_0++) g_ibuf_92[g_bars_88 - li_0] = 0.0;
      for (li_0 = 1; li_0 <= gi_76; li_0++) g_ibuf_96[g_bars_88 - li_0] = 0.0;
   }
   for (li_0 = g_bars_88 - gi_76; li_0 >= 0; li_0--) {
      ld_8 = High[iHighest(NULL, 0, MODE_HIGH, gi_76, li_0 - gi_76 + 1)];
      ld_16 = Low[iLowest(NULL, 0, MODE_LOW, gi_76, li_0 - gi_76 + 1)];
      ld_32 = ld_8 - (ld_8 - ld_16) * gd_80 / 100.0;
      g_ibuf_92[li_0 - gi_76 + 6] = ld_32;
      g_ibuf_96[li_0 - gi_76 - 1] = ld_32;
   }
   for (int li_40 = g_bars_88 - gi_76; li_40 >= 0; li_40--) {
      if (g_ibuf_92[li_40] > g_ibuf_96[li_40]) {
         g_ibuf_100[li_40] = 1;
         g_ibuf_104[li_40] = 0;
      } else {
         g_ibuf_100[li_40] = 0;
         g_ibuf_104[li_40] = -1;
      }
   }
   return (0);
}
Comments