labtrend1_v2.1_001
Download script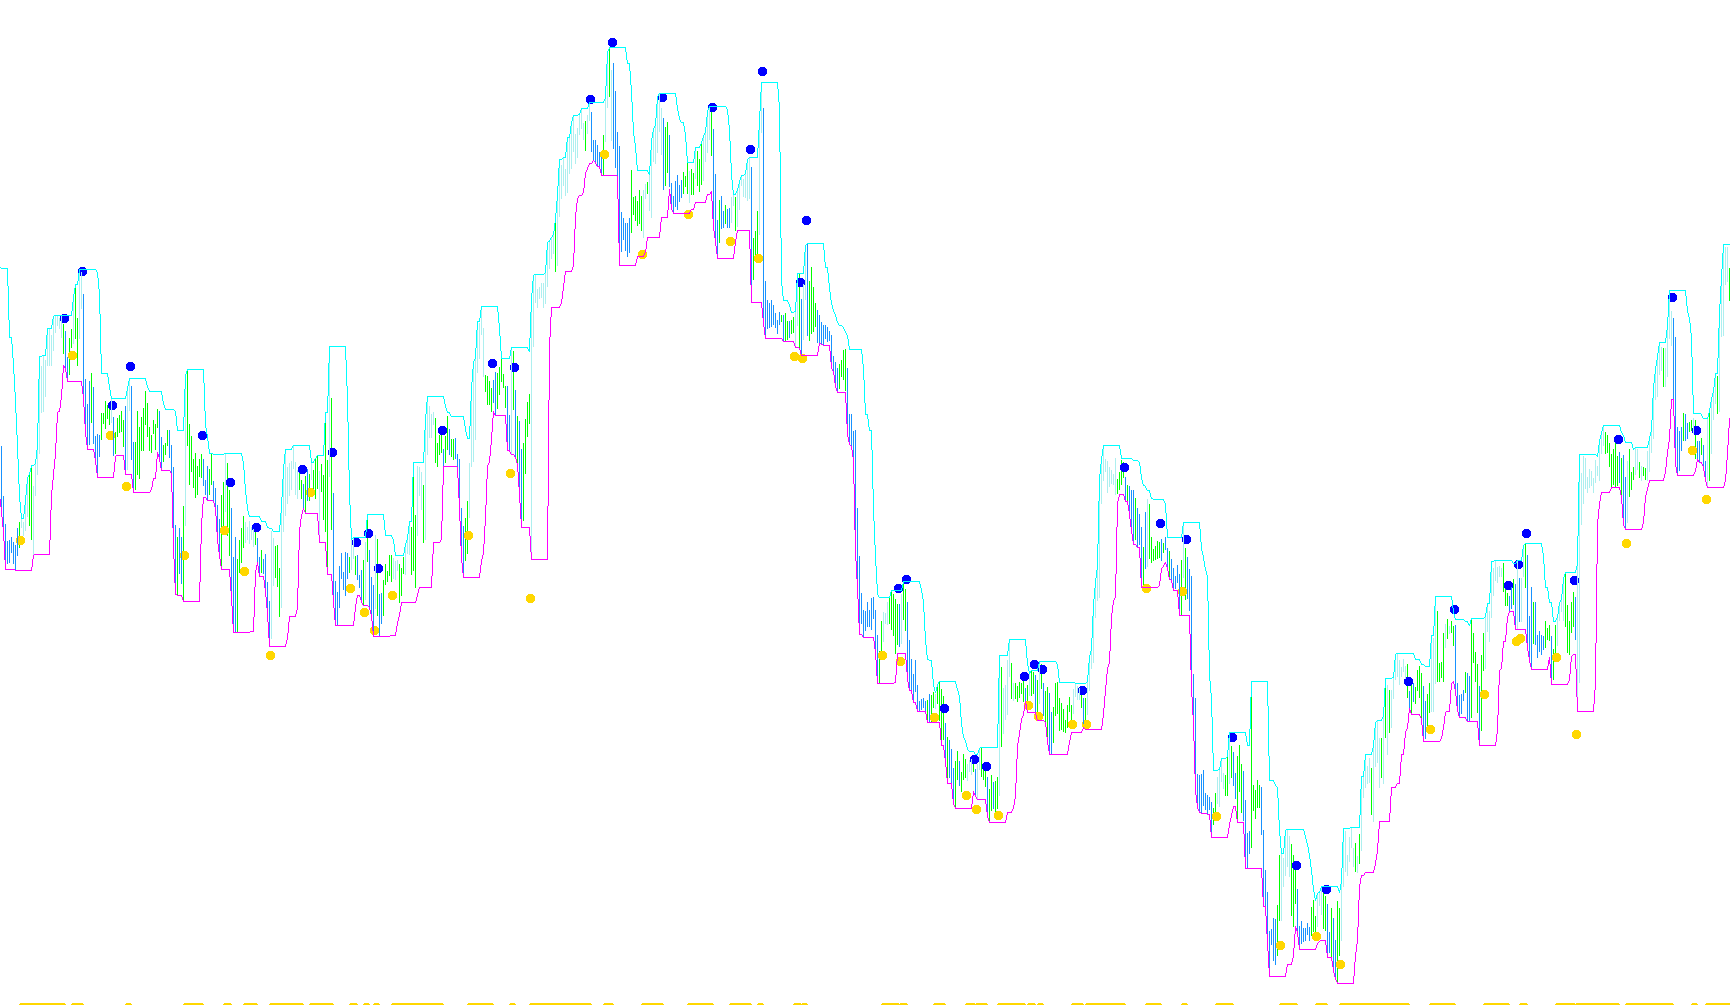
This script is designed to help traders identify the prevailing direction of the market by detecting breakouts from specific price channels. It simplifies market movements into "Up Trends" and "Down Trends" based on historical price extremes and user-defined risk factors.
How the Logic Works
1. Price Channel Detection The script constantly monitors a specific window of recent price history (determined by the "Length" setting). Within this window, it identifies the highest high and the lowest low. These two points form the boundaries of a "Price Channel."
2. Dynamic Risk Boundaries Unlike standard indicators that use fixed percentages, this tool uses a "Risk" factor to create dynamic support and resistance levels. It calculates a specific buffer zone above the channel's low and below the channel's high. This creates a "Signal Area"—the space where the price must move to confirm a trend change.
3. Trend Identification The logic determines the trend by watching for "breakouts":
- Bullish Trend: If the current market price closes above the upper boundary of the dynamic channel, the script registers an upward trend.
- Bearish Trend: If the current market price closes below the lower boundary of the dynamic channel, the script registers a downward trend.
4. Visual Signals and Alerts The script translates these mathematical calculations into visual aids on your chart:
- Arrows: When a trend flip occurs (e.g., moving from bearish to bullish), it places an arrow on the chart to notify you of the change.
- Color Bars: Based on your settings, the script can highlight price bars that stay consistently above or below the calculated boundaries, helping you visualize the strength of the current movement.
- Notifications: It includes a system to trigger sound alerts and pop-up messages on your screen at the exact moment a trend reversal is confirmed by both the price action and market volume.
Summary for the User
Essentially, this tool acts as an automated "trend watcher." It looks at how much the price has fluctuated recently, draws imaginary boundaries based on those fluctuations, and then alerts you the moment the price "breaks out" of those boundaries in a significant way. This helps traders stay on the right side of the market movement without having to manually guess where support and resistance levels might be.
//+------------------------------------------------------------------+
//|                                               LabTrend1_v2.1.mq4 |
//|                           Copyright © 2006, TrendLaboratory Ltd. |
//|            http://finance.groups.yahoo.com/group/TrendLaboratory |
//|                                       E-mail: igorad2004@list.ru |
//+------------------------------------------------------------------+
#property copyright "Copyright © 2006, TrendLaboratory Ltd."
#property link      "http://finance.groups.yahoo.com/group/TrendLaboratory"

#property indicator_chart_window
#property indicator_buffers 6
#property indicator_color1 Blue
#property indicator_color2 Red
#property indicator_color3 Blue
#property indicator_color4 Red
#property indicator_width3 0
#property indicator_width4 0
//---- input parameters

extern double  Risk           = 3;       //Price Channel narrowing factor (1..10)
extern int     TimeFrame      = 0;       //TimeFrame in min
extern int     Signal         = 1;       //Display signals mode
extern int     ColorBar       = 1;       //Display color bars mode: 0-no,1-yes
extern int     SoundAlertMode = 0;       //Sound Alert switch
extern int     WarningMode    = 0;       //Warning Alert switch
//---- indicator buffers
double UpTrendSignal[];
double DownTrendSignal[];
double UpTrendBar[];
double DownTrendBar[];
double smax[];
double smin[];
double trend[];

int    Length=9, time[2];
bool   Expert=true;
double BSMAX[2],BSMIN[2];
bool   UpTrendAlert=false, DownTrendAlert=false;
//+------------------------------------------------------------------+
//| Custom indicator initialization function                         |
//+------------------------------------------------------------------+
int init()
{
   string short_name;
//---- indicator line
   IndicatorBuffers(7);
   SetIndexBuffer(0,UpTrendSignal);
   SetIndexBuffer(1,DownTrendSignal);
   SetIndexBuffer(2,UpTrendBar);
   SetIndexBuffer(3,DownTrendBar);
   SetIndexBuffer(4,smax);
   SetIndexBuffer(5,smin);
   SetIndexBuffer(6,trend);
   SetIndexStyle(0,DRAW_ARROW);
   SetIndexStyle(1,DRAW_ARROW);
   SetIndexStyle(2,DRAW_HISTOGRAM);
   SetIndexStyle(3,DRAW_HISTOGRAM);
   SetIndexArrow(0,108);
   SetIndexArrow(1,108);
//---- name for DataWindow and indicator subwindow label
   short_name="LabTrend1("+DoubleToStr(Risk,2)+")";
   IndicatorShortName(short_name);
   SetIndexLabel(0,"UpTrend Signal");
   SetIndexLabel(1,"DownTrend Signal");
   SetIndexLabel(2,"UpTrend Bar");
   SetIndexLabel(3,"DownTrend Bar");
//----
   SetIndexEmptyValue(0,0.0);
   SetIndexEmptyValue(1,0.0);
   SetIndexEmptyValue(2,0.0);
   SetIndexEmptyValue(3,0.0);

   SetIndexDrawBegin(0,Length);
   SetIndexDrawBegin(1,Length);
   SetIndexDrawBegin(2,Length);
   SetIndexDrawBegin(3,Length);
//----
   return(0);
}
//+------------------------------------------------------------------+
//| LabTrend1_v2                                                     |
//+------------------------------------------------------------------+
int start()
{

   datetime TimeArray[];
   int    i,shift,y=0,MaxBar,limit,counted_bars=IndicatorCounted();
   double high, low, price, sum, UpBar,DnBar;
   double bsmax[1],bsmin[1];
   double LowArray[],HighArray[];


   int Line=0;            //Display line mode: 0-no,1-yes

   if (Bars-1<Length+1)return(0);
   if (counted_bars<0)return(-1);

   if (counted_bars>0) counted_bars--;

   MaxBar=Bars-1-Length-1;
   limit=Bars-counted_bars-1 + TimeFrame/Period();

   if (limit>MaxBar)
   {
      for (shift=limit;shift>=MaxBar;shift--)
      {
      smax[Bars-shift]=0.0;
      smin[Bars-shift]=0.0;
      UpTrendSignal[Bars-shift]=0.0;
      DownTrendSignal[Bars-shift]=0.0;
      UpTrendBar[Bars-shift]=0.0;
	   DownTrendBar[Bars-shift]=0.0;
      }
   limit=MaxBar;
   }
   if(ArrayResize(bsmin,limit+2)!=limit+2)return(-1);
   if(ArrayResize(bsmax,limit+2)!=limit+2)return(-1);

   int Tnew=Time[limit+1];

   if (limit<MaxBar)
      if (Tnew==time[1])
      {
      bsmin[limit+1]=BSMIN[1];
      bsmax[limit+1]=BSMAX[1];
      Expert=false;
      }
      else
      if (Tnew==time[0])
      {
      bsmin[limit+1]=BSMIN[0];
      bsmax[limit+1]=BSMAX[0];
      BSMIN[1]=BSMIN[0];
      BSMAX[1]=BSMAX[0];
      }
   else
   {
   if (Tnew>time[1])Print("Error1");
   else Print("Error2");
   return(-1);
   }
// Draw price channel boards + calculation : Channel middle, half channel width,
   ArrayCopySeries(TimeArray,MODE_TIME,Symbol(),TimeFrame);
   ArrayCopySeries(LowArray,MODE_LOW,Symbol(),TimeFrame);
   ArrayCopySeries(HighArray,MODE_HIGH,Symbol(),TimeFrame);

   for(shift=0,y=0;shift<limit;shift++)
   {
   if (Time[shift]<TimeArray[y]) y++;
      smin[shift]=10000000; smax[shift]=-100000000;
      for (i=Length-1;i>=0;i--)
      {
      smin[shift]=MathMin(smin[shift],LowArray[y+i]);
      smax[shift]=MathMax(smax[shift],HighArray[y+i]);
      }
   }

   for (shift=limit;shift>=0;shift--)
   {
   UpTrendSignal[shift]=0.0;
   DownTrendSignal[shift]=0.0;
   UpTrendBar[shift]=0.0;
	DownTrendBar[shift]=0.0;

// Calculation channel stop values

   bsmax[shift]=smax[shift]-(smax[shift]-smin[shift])*(33.0-Risk)/100.0;
	bsmin[shift]=smin[shift]+(smax[shift]-smin[shift])*(33.0-Risk)/100.0;

// Signal area : any conditions to trend determination:
// 1. Price Channel breakout

   trend[shift]=trend[shift+1];
   if(trend[shift+1]<0 && Close[shift]>bsmax[shift])  trend[shift]=1;
   if(trend[shift+1]>0 && Close[shift]<bsmin[shift])  trend[shift]=-1;

// Drawing area
   UpBar=bsmax[shift];
	DnBar=bsmin[shift];

      if (trend[shift]>0)
      {
         if (Signal>0 && trend[shift+1]<0)
         {
	      UpTrendSignal[shift]=Low[shift]-0.5*iATR(NULL,TimeFrame,10,shift);
	      if (WarningMode>0 && shift==0) PlaySound("alert2.wav");
	      }
	      else
	      UpTrendSignal[shift]=EMPTY_VALUE;

	      if(ColorBar>0)
	      {
            if(Close[shift]>UpBar)
	         {
	         UpTrendBar[shift]=High[shift];
	         DownTrendBar[shift]=Low[shift];
	         }
	         else
	         {
	         UpTrendBar[shift]=0.0;
	         DownTrendBar[shift]=0.0;
	         }
         }
	   }
      else
      if (trend[shift]<0)
	   {
         if (Signal==1 && trend[shift+1]>0)
	      {
	      DownTrendSignal[shift]=High[shift]+0.5*iATR(NULL,TimeFrame,10,shift);
	      if (WarningMode>0 && shift==0) PlaySound("alert2.wav");
	      }
	      else
	      DownTrendSignal[shift]=0.0;

         if(ColorBar>0)
	      {
            if(Close[shift]<DnBar)
	         {
	         UpTrendBar[shift]=Low[shift];
	         DownTrendBar[shift]=High[shift];
	         }
	         else
	         {
	         UpTrendBar[shift]=0.0;
	         DownTrendBar[shift]=0.0;
	         }
         }
	   }

      if ((shift==2)||((shift==1)&&(Expert==true)))
      {
      time [shift-1]=Time [shift];
      BSMIN[shift-1]=bsmin[shift];
      BSMAX[shift-1]=bsmax[shift];
      }
   }

//----------


   string Message;

   if ( trend[2]<0 && trend[1]>0 && Volume[0]>1 && !UpTrendAlert)
	{
	Message = " "+Symbol()+" M"+Period()+": LabTrend Signal for BUY";
	if ( SoundAlertMode>0  && NewBar() == true) Alert (Message);
	UpTrendAlert=true; DownTrendAlert=false;
	}

	if ( trend[2]>0 && trend[1]<0 && Volume[0]>1 && !DownTrendAlert)
	{
	Message = " "+Symbol()+" M"+Period()+": LabTrend Signal for SELL";
   if ( SoundAlertMode>0  && NewBar() == true) Alert (Message);
	DownTrendAlert=true; UpTrendAlert=false;
	}
//----
   return(0);
}
//+------------------------------------------------------------------+
bool NewBar()
{
   static datetime lastbar ;
   datetime curbar = Time[0];
   if(lastbar!=curbar)
   {
      lastbar=curbar;
      return (true);
   }
   else
   {
      return(false);
   }
}
Comments