Simple Delta + Accel
Download script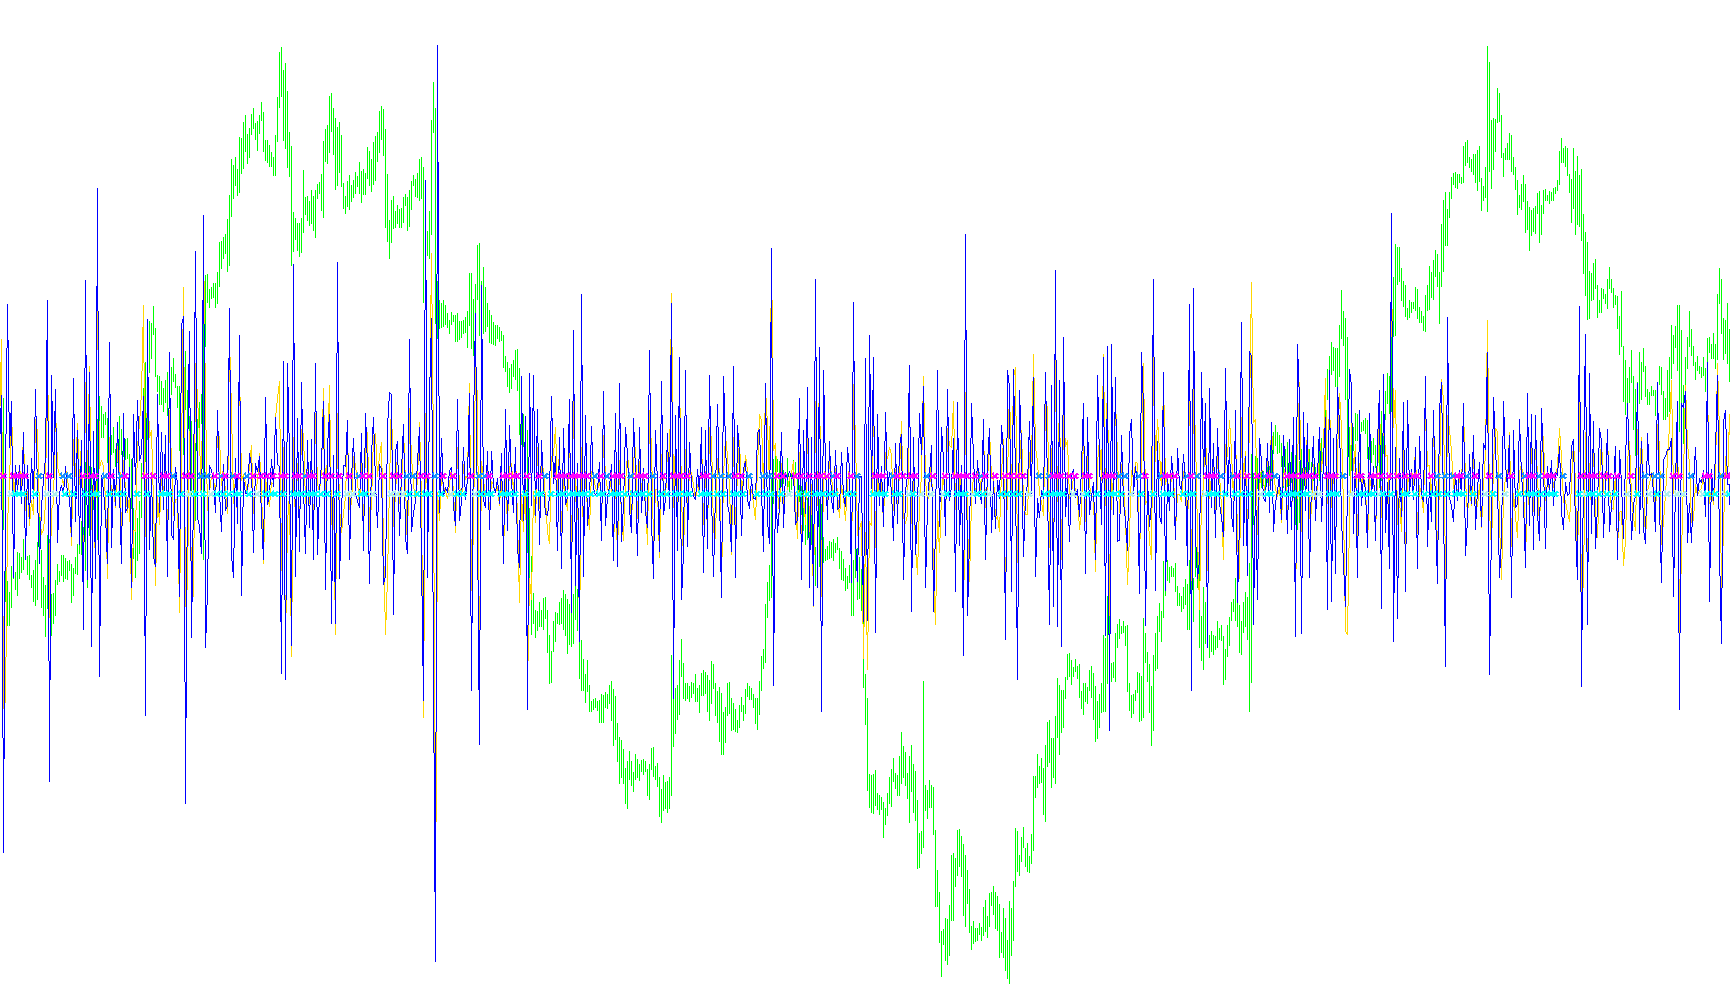
This indicator is designed to analyze market price movements by focusing on two primary mathematical concepts: Delta (velocity) and Acceleration. Rather than just looking at the current price, it measures how fast the price is changing and how that speed is increasing or decreasing over time.
Core Logic Breakdown
The script operates by calculating three distinct layers of price movement:
1. Price Delta (Velocity) The indicator first determines the "Delta," which is the difference between the current closing price and the previous closing price. This identifies the immediate direction and magnitude of the market move. If the price goes up, the delta is positive; if it goes down, the delta is negative.
2. Acceleration (Rate of Change) Beyond just knowing the price moved, the script calculates "Acceleration." This is derived by comparing the current Delta to the previous Delta.
- If the speed of the move is increasing, the market is accelerating.
- If the speed of the move is slowing down, even if it is still moving in the same direction, the indicator detects this deceleration.
3. Signal Generation The script uses these calculations to identify specific turning points and momentum shifts on the chart:
- Momentum Shifts (Stop Signals): The tool monitors for instances where the Delta crosses from negative to positive (or vice versa). These represent basic changes in trend direction.
- Confirmed Momentum Entries (Buy/Sell Signals): To filter out "noise" and provide more precise data, the script looks for a specific combination of both Delta and Acceleration. A high-confidence signal is generated only when:
- The price moves from negative to positive (Delta Change).
- AND the speed of that movement is simultaneously increasing (Acceleration Change).
Visual Representation
The indicator populates a separate window on your platform using different visual markers:
- Lines: These represent the raw Delta and Acceleration values, allowing you to see the "flow" of the market trends visually.
- Arrows/Markers: These highlight specific points where the criteria for trend changes or high-momentum entries are met, helping you identify potential pivot points in the price action.
//+------------------------------------------------------------------+
//|                                           Simple Delta + Accel.mq4 |
//|                                                       Andrew Haas |
//|                                         http://www.predictiononline.com |
//+------------------------------------------------------------------+
#property copyright "Andrew Haas"
#property link      "http://www.predictiononline.com"

#property indicator_separate_window
#property indicator_buffers 6
#property indicator_color1 Red
#property indicator_color2 Green
#property indicator_color3 Green
#property indicator_color4 Red
#property indicator_color5 Blue
#property indicator_color6 Purple

//---- buffers
double ExtMapBuffer1[];
double ExtMapBuffer2[];
double ExtMapBuffer3[];
double ExtMapBuffer4[];
double ExtMapBuffer5[];
double ExtMapBuffer6[];

//+------------------------------------------------------------------+
//| Custom indicator initialization function                         |
//+------------------------------------------------------------------+
int init()
  {
//---- indicators
   SetIndexStyle(0,DRAW_LINE);
   SetIndexStyle(1,DRAW_LINE);
   SetIndexStyle(2,DRAW_ARROW);
   SetIndexStyle(3,DRAW_ARROW);
   SetIndexStyle(4,DRAW_ARROW);
   SetIndexStyle(5,DRAW_ARROW);

   SetIndexBuffer(0,ExtMapBuffer1);
   SetIndexBuffer(1,ExtMapBuffer2);
   SetIndexBuffer(2,ExtMapBuffer3);
   SetIndexBuffer(3,ExtMapBuffer4);
   SetIndexBuffer(4,ExtMapBuffer5);
   SetIndexBuffer(5,ExtMapBuffer6);

   string short_name = "Simple Delta + Accel!";
   IndicatorShortName(short_name);
//----
   return(1);
  }
//+------------------------------------------------------------------+
//| Custor indicator deinitialization function                       |
//+------------------------------------------------------------------+
int deinit()
  {
//----

//----
   return(0);
  }
//+------------------------------------------------------------------+
//| Custom indicator iteration function                              |
//+------------------------------------------------------------------+
int start()
  {
   int    counted_bars=IndicatorCounted();

//---- check for possible errors
int delta = 1;
   if (counted_bars<0) return(-1);
//---- last counted bar will be recounted
   if (counted_bars>0) counted_bars--;

   int    pos=  Bars-counted_bars;
   int    pos2 = Bars - counted_bars;

   double dClose,dLastClose,dResult,dDelta,dLastDelta,dAccel,dLastAccel,dCrossedZero;
   double dLastResult;
   Comment("Hi! I'm here on the main chart windows!");
   bool lastValue = false;
   bool lastDelta = false;
   bool isBuy = false;
   bool printingBuy = false;
   bool bBuy,bSell = false;

//---- main calculation loop
   while(pos>=0)
     {
         dClose = Close[pos];
         dResult = dClose;
         if (lastValue == false)
         {
            ExtMapBuffer1[pos]= 0.0 ;
            ExtMapBuffer2[pos] = 0.0;
            dResult = 0.0;
         }
         else
         {
            dDelta = dClose - dLastClose;
            ExtMapBuffer1[pos] = dDelta;
            if (lastDelta == false)
            {
            ExtMapBuffer1[pos] = dDelta;
            ExtMapBuffer2[pos] = 0.0;
            lastDelta = true;
            }
            else
            {
             dAccel = dDelta - dLastDelta;
             ExtMapBuffer2[pos] = dAccel;

             // Stop Signals
             if ((dDelta > 0) && (dLastDelta < 0))
             {
              dCrossedZero = dDelta;
              ExtMapBuffer3[pos] = -0.0001;
              bBuy = true;
              // ObjectCreate("P label", OBJ_TEXT, 0, Time[0], P);
              //  ObjectSetText("P label", "Pivot " +DoubleToStr(P,4), 8, "Arial", EMPTY);
             }
             else
             {
               dCrossedZero = 0.0;
               ExtMapBuffer3[pos] = EMPTY_VALUE;
               bBuy = false;
             }

             if ((dDelta < 0) && (dLastDelta > 0))
             {
              // ExtMapBuffer3[pos] = 0.0001;
              ExtMapBuffer4[pos] = 0.0001;
              bSell = true;
             }
             else
             {
             // ExtMapBuffer3[pos] = EMPTY_VALUE;
               bSell = false;
             }


            // Buy/Sell Signals
             if ((dDelta > 0) && (dLastDelta < 0)
                 && (dAccel > 0) && (dLastAccel < 0) )
             {
              ExtMapBuffer5[pos] = -0.0001;
              bBuy = true;
              // ObjectCreate("P label", OBJ_TEXT, 0, Time[0], P);
              //  ObjectSetText("P label", "Pivot " +DoubleToStr(P,4), 8, "Arial", EMPTY);
             }
             else
             {
               dCrossedZero = 0.0;
               // ExtMapBuffer5[pos] = EMPTY_VALUE;
               bBuy = false;
             }

             if ((dDelta < 0) && (dLastDelta > 0)
                 && (dAccel < 0) && (dLastAccel > 0))
             {
              // ExtMapBuffer5[pos] = 0.0001;
              ExtMapBuffer6[pos] = 0.0001;
              bSell = true;
             }
             else
             {
             // ExtMapBuffer3[pos] = EMPTY_VALUE;
               bSell = false;
             }


           }
         }
         dLastClose = dClose;
         dLastResult = dResult;
         dLastDelta = dDelta;
         dLastAccel = dAccel;
         lastValue = true;
         pos--;
     }
//----
   return(0);
  }
//+------------------------------------------------------------------+
Comments