LSMA in Color_v2
Download script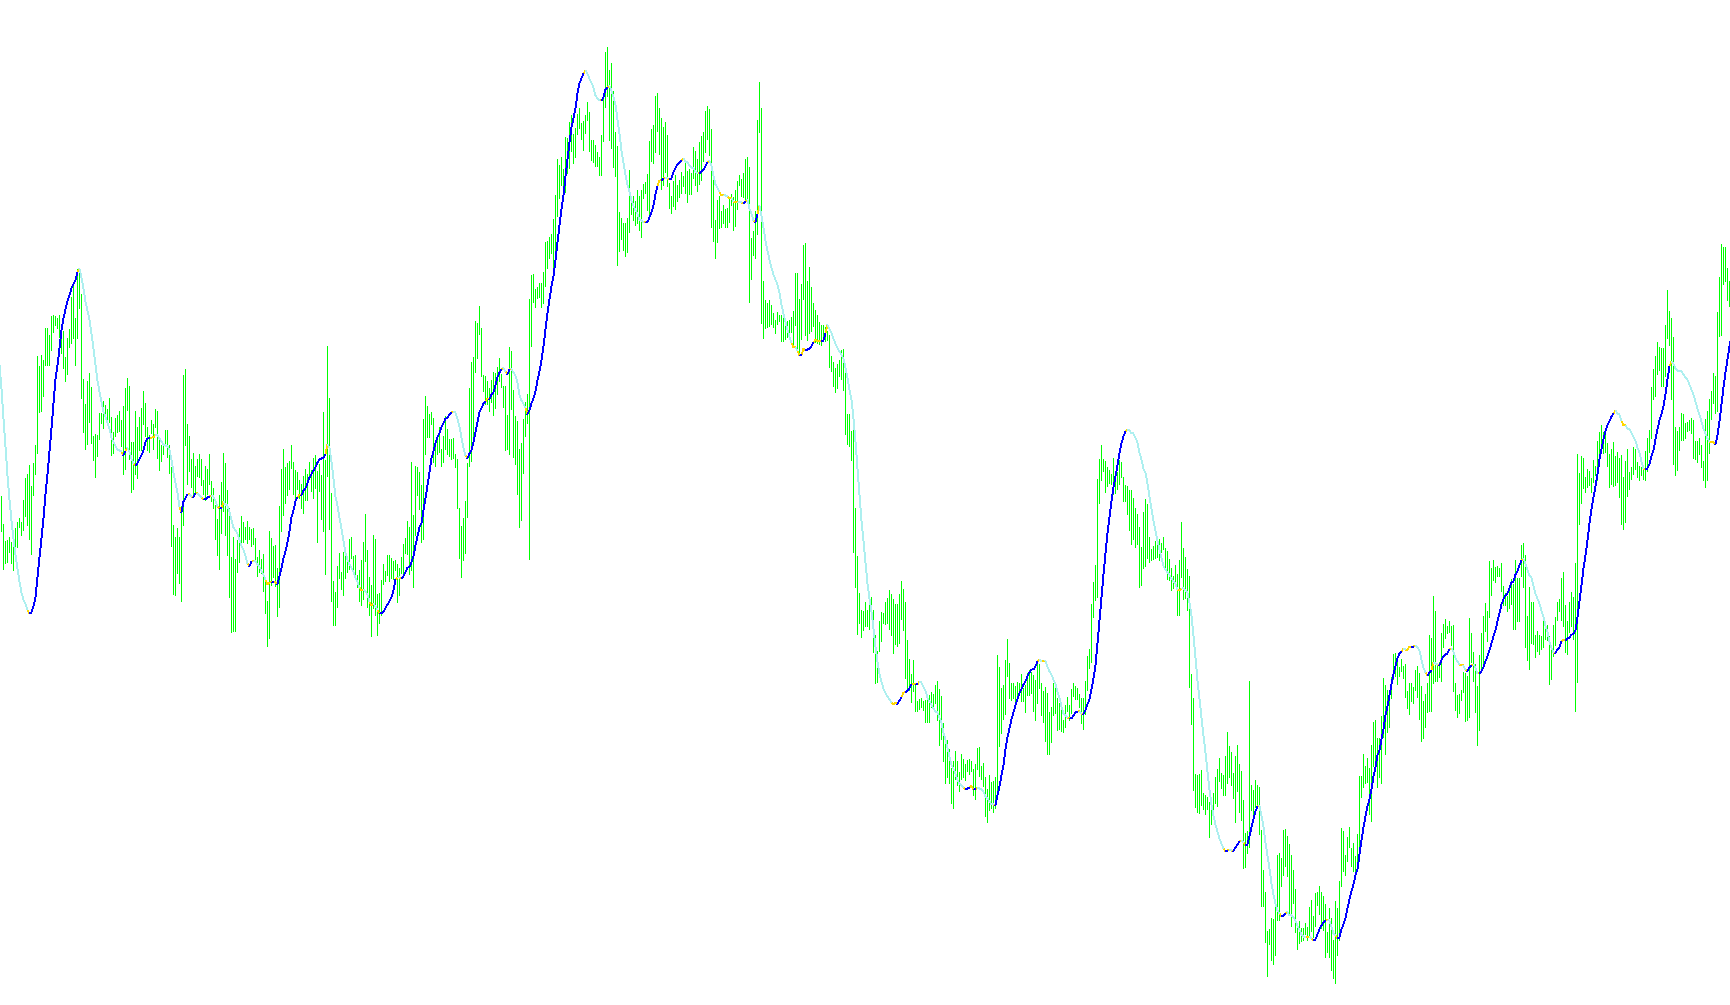
This tool is designed to provide traders with a visual representation of market momentum by calculating a specialized moving average on the price chart. Unlike standard moving averages that treat all historical data equally, this script utilizes a specific mathematical approach to prioritize more recent price action while maintaining a smooth flow of information.
Core Logic and Calculation
The script analyzes a predefined period of historical price data (the "Lookback Period") to determine the current trend. It calculates a weighted value where each price point within that period is assigned a specific importance based on its position in time. By applying these weights, the indicator creates a smoothed line that reflects the "velocity" or "strength" of the current market direction.
Visual Dynamics and Color Coding
The primary goal of this script is to provide an intuitive visual cue regarding trend changes. It achieves this by dynamically shifting colors on the chart line based on the relationship between the current price movement and the previous one:
- Trend Identification: The indicator monitors whether the calculated weighted value is moving upward or downward.
- Color Transitions: By comparing the current calculation to the one immediately preceding it, the script "turns on" specific colors to highlight the direction of the trend.
- Seamless Visualization: When the direction of the trend changes, the script clears out the previous color signals and applies the new color. This ensures that the chart remains clean and only shows the active, relevant trend data at any given moment.
Summary for the User
Essentially, this tool transforms complex weighted calculations into a simplified visual signal. Instead of requiring you to manually interpret whether price momentum is accelerating or decelerating, the script does the math in the background and uses distinct colors to highlight the direction of the trend in real-time, helping you stay aligned with the prevailing market movement.
//+------------------------------------------------------------------+
//|                                               LSMA in Color      |
//|                      Copyright © 2004, MetaQuotes Software Corp. |
//|                                       http://www.metaquotes.net/ |
//+------------------------------------------------------------------+
#property  copyright "Copyright © 2005, FX Sniper "
#property  link      "http://www.metaquotes.net/"
//---- indicator settings
#property  indicator_chart_window
#property  indicator_buffers 3
#property indicator_color1 Yellow
#property indicator_color2 Green
#property indicator_color3 Red
//---- buffers
double ExtMapBuffer1[];
double ExtMapBuffer2[];
double ExtMapBuffer3[];
int width;
//----
extern int Rperiod=34;
extern int Draw4HowLongg=1500;
int Draw4HowLong;
int shift;
int i;
int loopbegin;
double sum[];
int length;
double lengthvar;
double tmp ;
double wt[];
int c;
//+------------------------------------------------------------------+
//| Custom indicator initialization function                         |
//+------------------------------------------------------------------+
int init()
  {
//---- 2 additional buffers are used for counting.
   IndicatorBuffers(5);
//---- drawing settings
   SetIndexBuffer(2,ExtMapBuffer1);
   SetIndexBuffer(1,ExtMapBuffer2);
   SetIndexBuffer(0,ExtMapBuffer3);
   SetIndexBuffer(3,sum);
   SetIndexBuffer(4,wt);
   SetIndexStyle(2,DRAW_LINE,STYLE_SOLID,2);
   SetIndexStyle(1,DRAW_LINE,STYLE_SOLID,2);
   SetIndexStyle(0,DRAW_LINE,STYLE_SOLID,2);
//---- initialization done
   return(0);
  }
//+------------------------------------------------------------------+
//|                                                                  |
//+------------------------------------------------------------------+
int start()
  {
   Draw4HowLong=Bars-Rperiod - 5;
   length=Rperiod;
   loopbegin=Draw4HowLong - length - 1;
//----
   for(shift=loopbegin; shift>=0; shift--)
     {
      sum[1]=0;
      for(i=length; i>=1 ;i--)
        {
         lengthvar=length + 1;
         lengthvar/=3;
         tmp=0;
         tmp =(i - lengthvar)*Close[length-i+shift];
         sum[1]+=tmp;
        }
      wt[shift]=sum[1]*6/(length*(length+1));
//---- COLOR CODING
      ExtMapBuffer3[shift]=wt[shift]; //red
      ExtMapBuffer2[shift]=wt[shift]; //green
      ExtMapBuffer1[shift]=wt[shift]; //yellow
      //  for(c=loopbegin;c==shift;c++)
      // {
      if (wt[shift+1] > wt[shift])
        {
         ExtMapBuffer2[shift+1]=EMPTY_VALUE;
         // ObjectCreate("smiley_face", OBJ_ARROW, 0, Time[shift], Low[shift]-Point*20);
         // Print("time=  ",Time[shift]);
         // ObjectSet("smiley_face", OBJPROP_ARROWCODE, 242);
         // ObjectSet("smiley_face", OBJPROP_COLOR , Red);
         // ObjectSet("smiley_face", OBJPROP_WIDTH  , 1);
         // ObjectsRedraw();
         //ExtMapBuffer3[shift+1] = EMPTY_VALUE;
         //ExtMapBuffer3[shift+1] = EMPTY_VALUE;
        }
      else if (wt[shift+1] < wt[shift])
           {
            ExtMapBuffer1[shift+1]=EMPTY_VALUE; //-1 red/greem tight
            //ExtMapBuffer3[shift+1] = EMPTY_VALUE;
           }
            else
           {
            ExtMapBuffer1[shift+1]=CLR_NONE;//EMPTY_VALUE;
            ExtMapBuffer2[shift+1]=CLR_NONE;//EMPTY_VALUE;
           }
     }
   return(0);
  }
//+------------------------------------------------------------------+
Comments