LSMA in Color4
Download script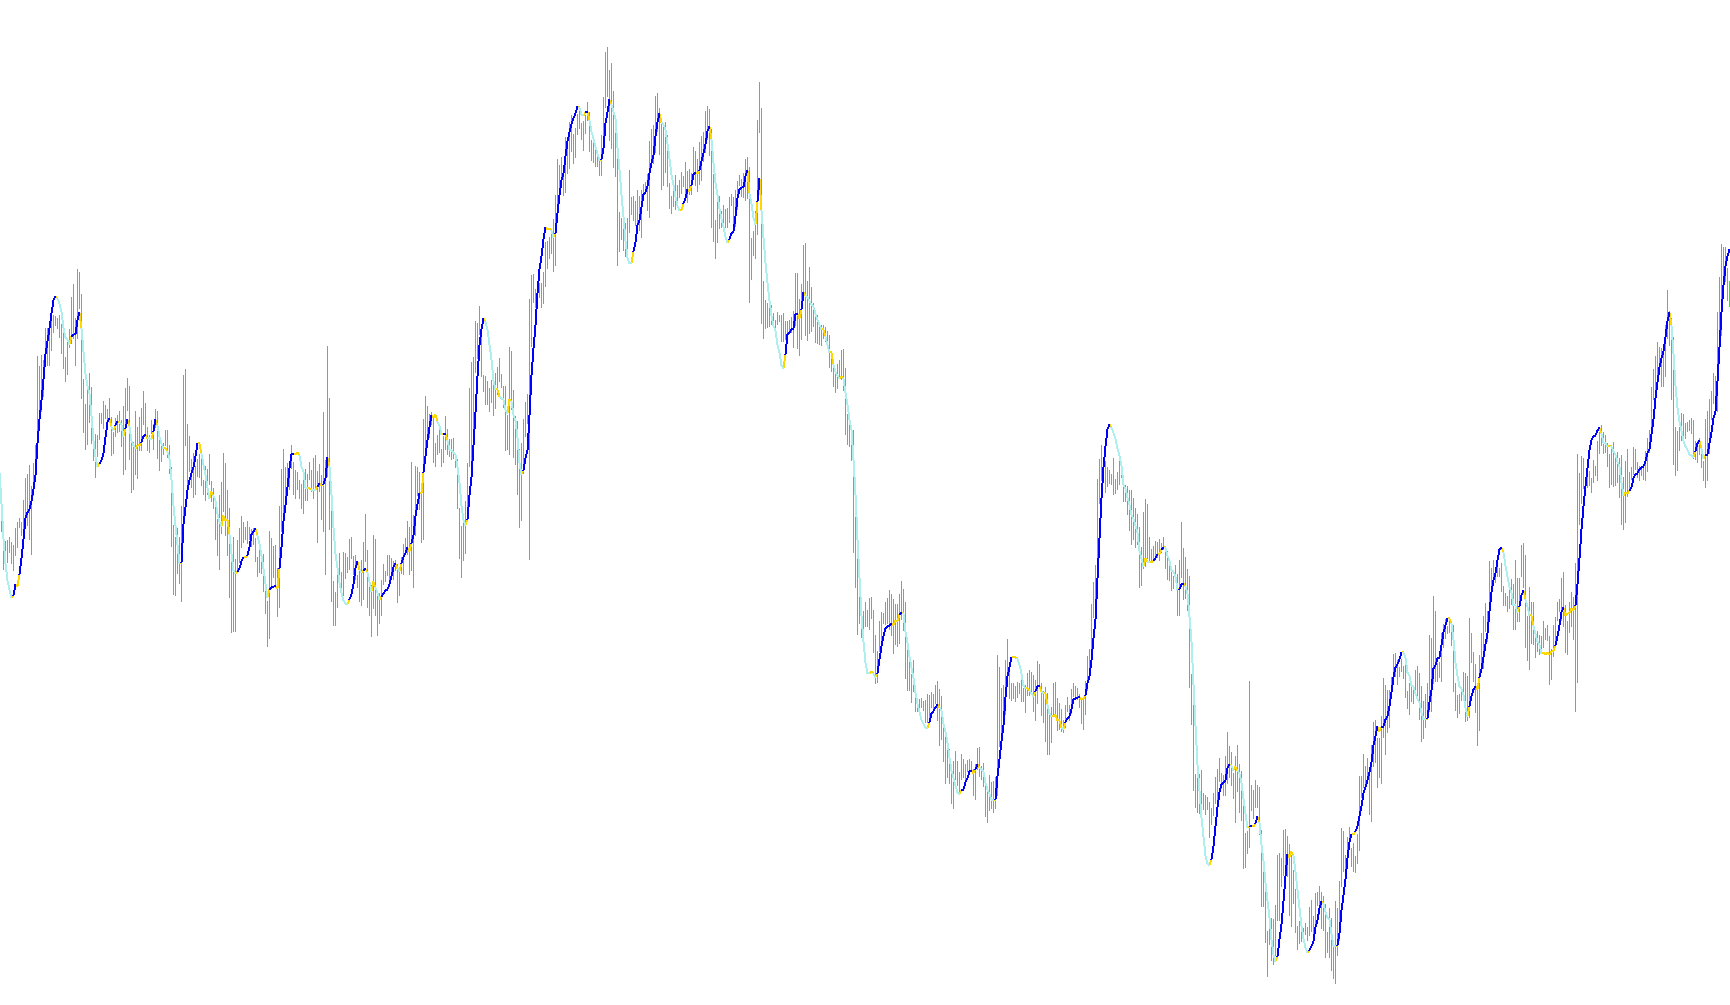
This tool is designed as a visual market indicator for MetaTrader, providing traders with a streamlined way to track price momentum and trends directly on their charts. Instead of cluttering the screen with complex raw data, it translates historical price movements into clear, color-coded visual signals.
Core Logic and Functionality
The script operates by performing a specific type of weighted analysis on recent price history. Here is how that process works in plain terms:
1. Data Processing The indicator looks back at a predetermined number of past price points (defined by the user). Rather than giving every price point equal importance, it applies a "weighting" calculation. This means that prices closer to the current moment have a different impact on the final result than older prices. By doing this, the script attempts to filter out "noise" and focus on the most relevant recent trends.
2. Trend Calculation The tool calculates a moving value based on these weighted prices. As the market moves up or down, this value fluctuates. The logic focuses specifically on the change between the current calculated value and the one immediately preceding it.
3. Visual Communication (Color Coding) The primary purpose of this script is to translate those mathematical changes into a visual guide using three distinct colors:
- Green Signals: These appear when the trend momentum is increasing compared to the previous period. It serves as a visual cue for upward movement.
- Yellow Signals: These highlight specific directional shifts or movements where the price is gaining strength in a different trajectory.
- Red Signals: These appear when the downward momentum is accelerating, signaling a potential decline.
4. Dynamic Filtering The script includes logic to "hide" colors that are no longer relevant. If the trend does not change in a specific direction, the indicator clears the previous color (setting it to an "empty" state). This ensures that the chart remains clean, only showing you the active movements of the market rather than leaving old, misleading data points on your screen.
Summary for the User
In short, this script acts as a visual translator for price momentum. It takes a complex set of weighted price calculations and simplifies them into a continuous line that changes color to tell you at a glance whether the current trend is strengthening, weakening, or shifting direction.
//+------------------------------------------------------------------+
//|                                                        |
//|                      Copyright © 2004, MetaQuotes Software Corp. |
//|                                       http://www.metaquotes.net/ |
//+------------------------------------------------------------------+
#property  copyright "Copyright © 2005, FX Sniper "
#property  link      "http://www.metaquotes.net/"

//---- indicator settings
#property  indicator_chart_window
#property  indicator_buffers 3
#property indicator_color1 Yellow
#property indicator_color2 Green
#property indicator_color3 Red
#property indicator_width1 2
#property indicator_width2 2
#property indicator_width3 2


//---- buffers
double ExtMapBuffer1[];
double ExtMapBuffer2[];
double ExtMapBuffer3[];
int width;

extern int Rperiod = 14;
extern int Draw4HowLongg = 1500;
int Draw4HowLong;
int shift;
int i;
int loopbegin;
double sum[];
int length;
double lengthvar;
double tmp ;
double wt[];
int c;

//+------------------------------------------------------------------+
//| Custom indicator initialization function                         |
//+------------------------------------------------------------------+
int init()
  {
//---- 2 additional buffers are used for counting.
   IndicatorBuffers(5);

//---- drawing settings
   SetIndexBuffer(2,ExtMapBuffer1);
   SetIndexBuffer(1,ExtMapBuffer2);
   SetIndexBuffer(0,ExtMapBuffer3);
   SetIndexBuffer(3,sum);
   SetIndexBuffer(4,wt);

   SetIndexStyle(2,DRAW_LINE,STYLE_SOLID,2);
   SetIndexStyle(1,DRAW_LINE,STYLE_SOLID,2);
   SetIndexStyle(0,DRAW_LINE,STYLE_SOLID,2);

//---- initialization done
   return(0);
  }

int start()

  {   Draw4HowLong = Bars-Rperiod - 5;
      length = Rperiod;
      loopbegin = Draw4HowLong - length - 1;

      for(shift = loopbegin; shift >= 0; shift--)
      {
         sum[1] = 0;
         for(i = length; i >= 1  ; i--)
         {
         lengthvar = length + 1;
         lengthvar /= 3;
         tmp = 0;
         tmp = ( i - lengthvar)*Close[length-i+shift];
         sum[1]+=tmp;
         }
         wt[shift] = MathFloor(sum[1]*6/(length*(length+1))/Point)*Point;

//========== COLOR CODING ===========================================

       ExtMapBuffer3[shift] = wt[shift]; //red
       ExtMapBuffer2[shift] = wt[shift]; //green
       ExtMapBuffer1[shift] = wt[shift]; //yellow

       //  for(c=loopbegin;c==shift;c++)
       // {
        if (wt[shift+1] > wt[shift])
        {
        ExtMapBuffer2[shift] = EMPTY_VALUE;
  // ObjectCreate("smiley_face", OBJ_ARROW, 0, Time[shift], Low[shift]-Point*20);
  // Print("time=  ",Time[shift]);
  // ObjectSet("smiley_face", OBJPROP_ARROWCODE, 242);
  // ObjectSet("smiley_face", OBJPROP_COLOR , Red);
  // ObjectSet("smiley_face", OBJPROP_WIDTH  , 1);
  // ObjectsRedraw();

        //ExtMapBuffer3[shift+1] = EMPTY_VALUE;
        //ExtMapBuffer3[shift+1] = EMPTY_VALUE;

        }
       else if (wt[shift+1] < wt[shift])
        {
        ExtMapBuffer1[shift] = EMPTY_VALUE; //-1 red/greem tight
       //ExtMapBuffer3[shift+1] = EMPTY_VALUE;

        }
         else
         {

         ExtMapBuffer1[shift]=EMPTY_VALUE;//EMPTY_VALUE;
         ExtMapBuffer2[shift]=EMPTY_VALUE;//EMPTY_VALUE;
         }

      }

      return(0);
  }
//+------------------------------------------------------------------+
Comments