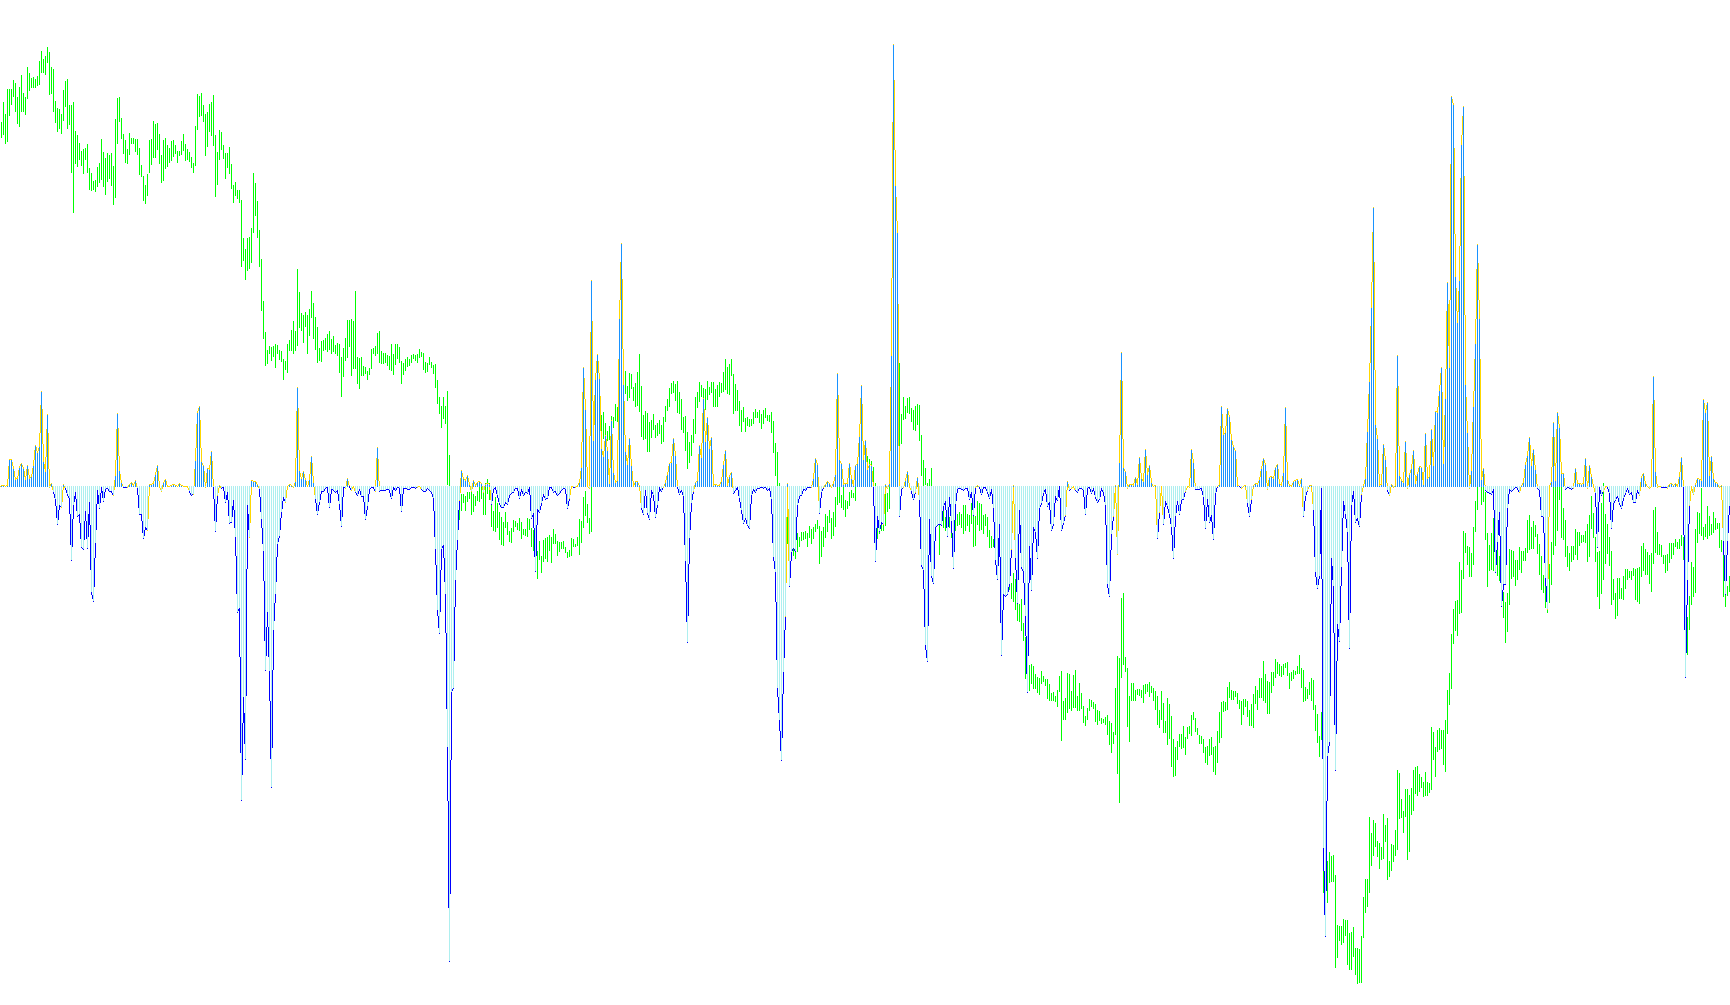
This tool is designed to analyze price movements by focusing on the "slope" or direction of a specific type of moving average. Rather than just showing you where the price is currently sitting, it calculates how much momentum and stability are behind the current trend to help identify shifts in market behavior.
Core Logic and Mechanics
The indicator operates using three primary layers of calculation to provide a clear visual of market sentiment:
1. Noise Reduction and Efficiency The script first evaluates the "signal-to-noise" ratio of the market. It measures the net price change over a specific period and compares it against the total volatility (the sum of all individual price fluctuations) during that same timeframe. By dividing the net movement by the total volatility, the tool determines how much of the recent price action is an actual trend versus just random market "noise."
2. Adaptive Smoothing The indicator uses a sophisticated smoothing technique that adjusts based on the results of the noise calculation. It balances two speeds: a fast response and a slow response. When the market is moving efficiently (clear trend), the indicator reacts more dynamically; when the market is volatile and erratic (high noise), the smoothing becomes heavier to prevent false signals. This helps filter out minor price wiggles while staying responsive to significant structural changes.
3. Slope Detection The final output represents the "Slope." Instead of plotting a traditional moving average line, this script calculates the difference between the current smoothed value and its previous value.
- Positive Slope: Indicates upward momentum.
- Negative Slope: Indicates downward momentum.
Visual Representation
To make this data easy to read at a glance, the tool translates these mathematical calculations into a visual dashboard:
- Dynamic Histograms: The indicator uses a dual-histogram system. It separates upward movements from downward movements into distinct colors (typically Green for positive and Red for negative). This allows you to see the strength of the current trend instantly; the taller the histogram, the stronger the momentum.
- Trend Lines: The tool plots specific lines that act as "trigger" thresholds. These serve as visual boundaries to help determine when a change in slope has become significant enough to be considered a potential shift in market direction.
Summary for the User
Essentially, this script acts as a filter. It ignores the "choppiness" of the market and tries to reveal the underlying heartbeat of the price action. By looking at the height and direction of the histograms, you can see whether the current trend is gaining strength, losing steam, or if the market is entering a period of high-noise consolidation where no clear trend exists.
//+------------------------------------------------------------------+
//|                                                    AMA SLOPE.mq4 |
//|                                                          Kalenzo |
//|                                     bartlomiej.gorski@gmail.com  |
//| I used the idea of P.Kauffman and code from KAMA                 |
//| made by © 2004, by konKop,wellx                                  |
//+------------------------------------------------------------------+
#property copyright "Kalenzo"
#property link      "bartlomiej.gorski@gmail.com"

#property indicator_separate_window
#property indicator_buffers 4
#property indicator_color1 Green
#property indicator_color2 Red
#property indicator_color3 Red
#property indicator_color4 Green
#property indicator_level1 0

//---- input parameters
extern int       periodAMA=9;
extern int       nfast=2;
extern int       nslow=30;
extern double    G=2.0;
extern int       trigger = 2;
extern color     triggerPlus = Green;
extern color     triggerMinus = Red;
//---- buffers
double kAMAbuffer[];
double kAMAbuffer2[];

double amahisto1[];
double amahisto2[];
//+------------------------------------------------------------------+

int    cbars=0, prevbars=0, prevtime=0;

double slowSC,fastSC;

//+------------------------------------------------------------------+
//| Custom indicator initialization function                         |
//+------------------------------------------------------------------+
int init()
  {
//---- indicators
   SetIndexStyle(0,DRAW_LINE,0,1);
   SetIndexBuffer(0,kAMAbuffer);
   SetIndexStyle(1,DRAW_LINE,0,1);
   SetIndexBuffer(1,kAMAbuffer2);

   SetIndexStyle(2,DRAW_HISTOGRAM,0,1);
   SetIndexBuffer(2,amahisto1);
   SetIndexStyle(3,DRAW_HISTOGRAM,0,1);
   SetIndexBuffer(3,amahisto2);

   IndicatorDigits(4);
   IndicatorShortName("AMA SLOPE");

   drawLine((trigger*Point),"Trigger+", triggerPlus);
   drawLine((-trigger*Point),"Trigger-", triggerMinus);


   return(0);
  }
//+------------------------------------------------------------------+
//| Custom indicator deinitialization function                       |
//+------------------------------------------------------------------+
int deinit()
  {
   return(0);
  }
//+------------------------------------------------------------------+
//| Custom indicator iteration function                              |
//+------------------------------------------------------------------+
int start()
  {

   int    i,pos=0;
   double noise=0.000000001,AMA,AMA0,signal,ER;
   double dSC,ERSC,SSC,ddK;

   if (prevbars==Bars) return(0);

   slowSC=(2.0 /(nslow+1));
   fastSC=(2.0 /(nfast+1));

   cbars=IndicatorCounted();

   if (Bars<=(periodAMA+2)) return(0);
   if (cbars<0) return(-1);
   if (cbars>0) cbars--;
   pos=Bars-periodAMA-2;
   AMA0=Close[pos+1];
   while (pos>=0)
     {
      if(pos==Bars-periodAMA-2) AMA0=Close[pos+1];
      signal=MathAbs(Close[pos]-Close[pos+periodAMA]);
      noise=0.000000001;
      for(i=0;i<periodAMA;i++)
       {
        noise=noise+MathAbs(Close[pos+i]-Close[pos+i+1]);
       }
      ER =signal/noise;
      dSC=(fastSC-slowSC);
      ERSC=ER*dSC;
      SSC=ERSC+slowSC;
      AMA=AMA0+(MathPow(SSC,G)*(Close[pos]-AMA0));


      ddK=(AMA-AMA0);
      kAMAbuffer[pos]=ddK;

      if(ddK<0)
      kAMAbuffer2[pos]=ddK;

      if(ddK<0)
      {
         amahisto1[pos] = ddK;
         amahisto2[pos] = 0;
      }
      else
      {
         amahisto2[pos] = ddK;
         amahisto1[pos] = 0;
      }

      AMA0=AMA;
      pos--;
     }
//----

   prevbars=Bars;
   return(0);
  }

void drawLine(double lvl,string name, color Col)
{
         if(ObjectFind(name) == 0)
         {
            ObjectCreate(name, OBJ_HLINE, WindowFind("AMA SLOPE") , Time[0], lvl,Time[0],lvl);
            ObjectSet(name, OBJPROP_STYLE, STYLE_DOT);
            ObjectSet(name, OBJPROP_COLOR, Col);
            ObjectSet(name,OBJPROP_WIDTH,1);
         }
         else
         {
            ObjectDelete(name);
            ObjectCreate(name, OBJ_HLINE, WindowFind("AMA SLOPE") , Time[0], lvl,Time[0],lvl);
            ObjectSet(name, OBJPROP_STYLE, STYLE_DOT);
            ObjectSet(name, OBJPROP_COLOR, Col);
            ObjectSet(name,OBJPROP_WIDTH,1);
         }
}
Comments