ma_x2_roc
Download script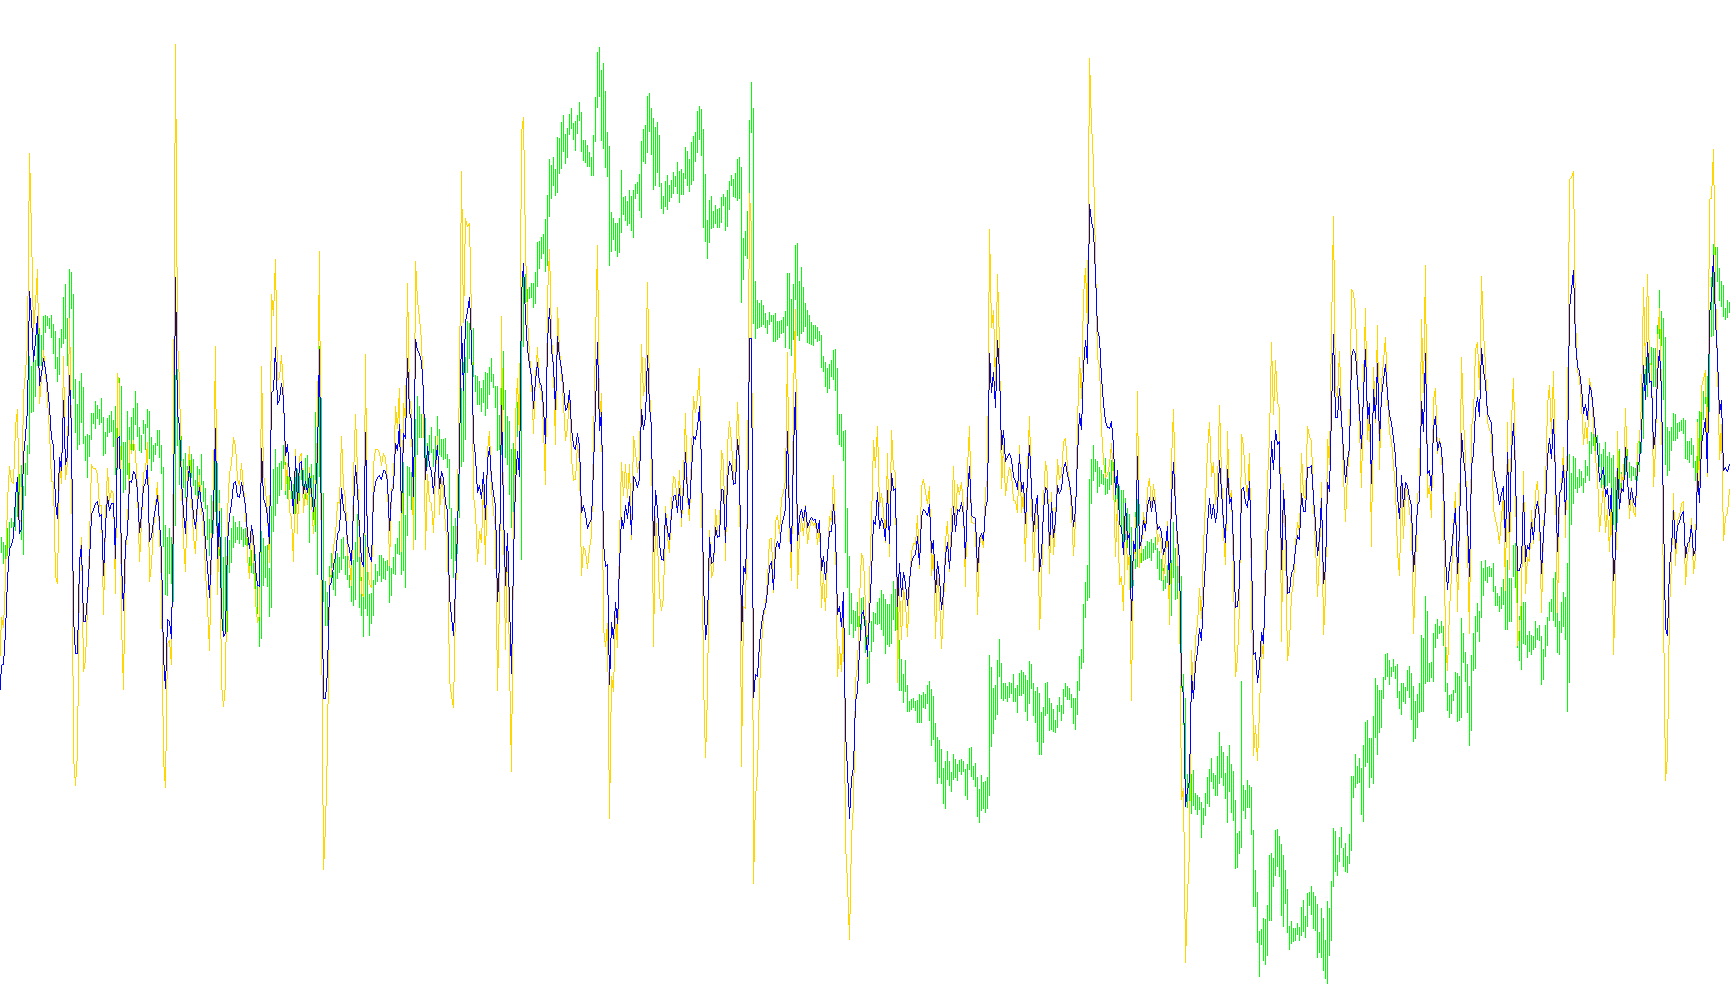
This custom indicator is designed to help traders visualize the momentum and rate of change of two different moving averages simultaneously. Instead of showing you the price directly, it focuses on how fast the market trends are moving, which can help in identifying whether a trend is accelerating, slowing down, or reversing.
Core Logic Overview
The tool operates by calculating two distinct Moving Averages (MA) based on user-defined periods and methods. It then transforms these averages into a "Rate of Change" percentage. This allows you to see the "speed" of the trend in a separate window rather than on the main price chart.
How it Works
- Dual Moving Average Tracking: The script calculates two separate moving averages at once. By default, these are set to different timeframes (e.g., 7 and 13 periods), allowing you to compare a "fast" trend against a "slow" trend.
- Momentum Calculation: For each of these moving averages, the script looks at the current value and compares it to its previous value. It calculates the difference between these two points as a percentage.
- Visual Representation: The results are displayed as two separate lines:
- Blue Line: Represents the rate of change for the first (shorter) moving average.
- Red Line: Represents the rate of change for the second (longer) moving average.
Key Features for the Trader
- Separate Window Display: Because this tool measures percentages rather than price, it appears in a dedicated sub-window at the bottom of your screen. This prevents it from cluttering your main price candles.
- Neutral Zones: The indicator includes designated horizontal levels (0.03 and -0.03). These act as "neutral zones," helping you distinguish between significant momentum shifts and minor market noise.
- Customizable Sensitivity: You can adjust the periods, calculation methods, and price types for both moving averages. This flexibility allows you to tailor the tool to different assets (like Forex, Stocks, or Crypto) or various trading styles (scalping vs. swing trading).
By observing where these two lines sit in relation to each other and the zero line, traders can get a clearer picture of market velocity and potential trend exhaustion.
//+------------------------------------------------------------------+
//|                                                                  |
//|                                                                  |
//+------------------------------------------------------------------+
//2009fxtsd ma x2
#property copyright ""
#property link      ""

#property indicator_separate_window
#property indicator_buffers    2
#property indicator_color1     Blue
#property indicator_color2     Red

//#property indicator_width1     1

#property indicator_level1      0.03
#property indicator_level2     -0.03
#property indicator_levelcolor DarkSlateGray


extern int ma1period      = 7;
extern int ma1method      = 1;
extern int ma1price       = 0;

extern int ma2period      = 13;
extern int ma2method      = 1;
extern int ma2price       = 0;

extern int slopePeriod=1;


double buffer1[];
double buffer2[];
double buffer3[];
double buffer4[];
//+------------------------------------------------------------------+
//|                                                                  |
//+------------------------------------------------------------------+

int init()
{
      IndicatorBuffers(4);


   SetIndexBuffer(0,buffer1);
   SetIndexBuffer(1,buffer2);
   SetIndexBuffer(2,buffer3);
   SetIndexBuffer(3,buffer4);

   IndicatorShortName("2ma roc " );
   SetIndexLabel(0,"ma1 "+ma1period);
   SetIndexLabel(1,"ma2"+ma2period);


   return(0);
}


//+------------------------------------------------------------------+


int start()
{
   int counted_bars=IndicatorCounted();
   int limit,i;

   if(counted_bars<0) return(-1);
   if(counted_bars>0) counted_bars--;
           limit=Bars-counted_bars;


   for(i=limit; i>=0; i--)
   {
     buffer3[i]  = iMA(NULL, 0, ma1period, 0,ma1method, ma1price, i);
     buffer4[i]  = iMA(NULL, 0, ma2period, 0,ma2method, ma2price, i);


         if (buffer3[i]&&buffer4[i]!=0)
         {
          buffer1[i]=100*(buffer3[i]-buffer3[i+slopePeriod])/buffer3[i];
          buffer2[i]=100*(buffer4[i]-buffer4[i+slopePeriod])/buffer4[i];
          }

  }

   return(0);
}
Comments