HiLo Lines1
Download script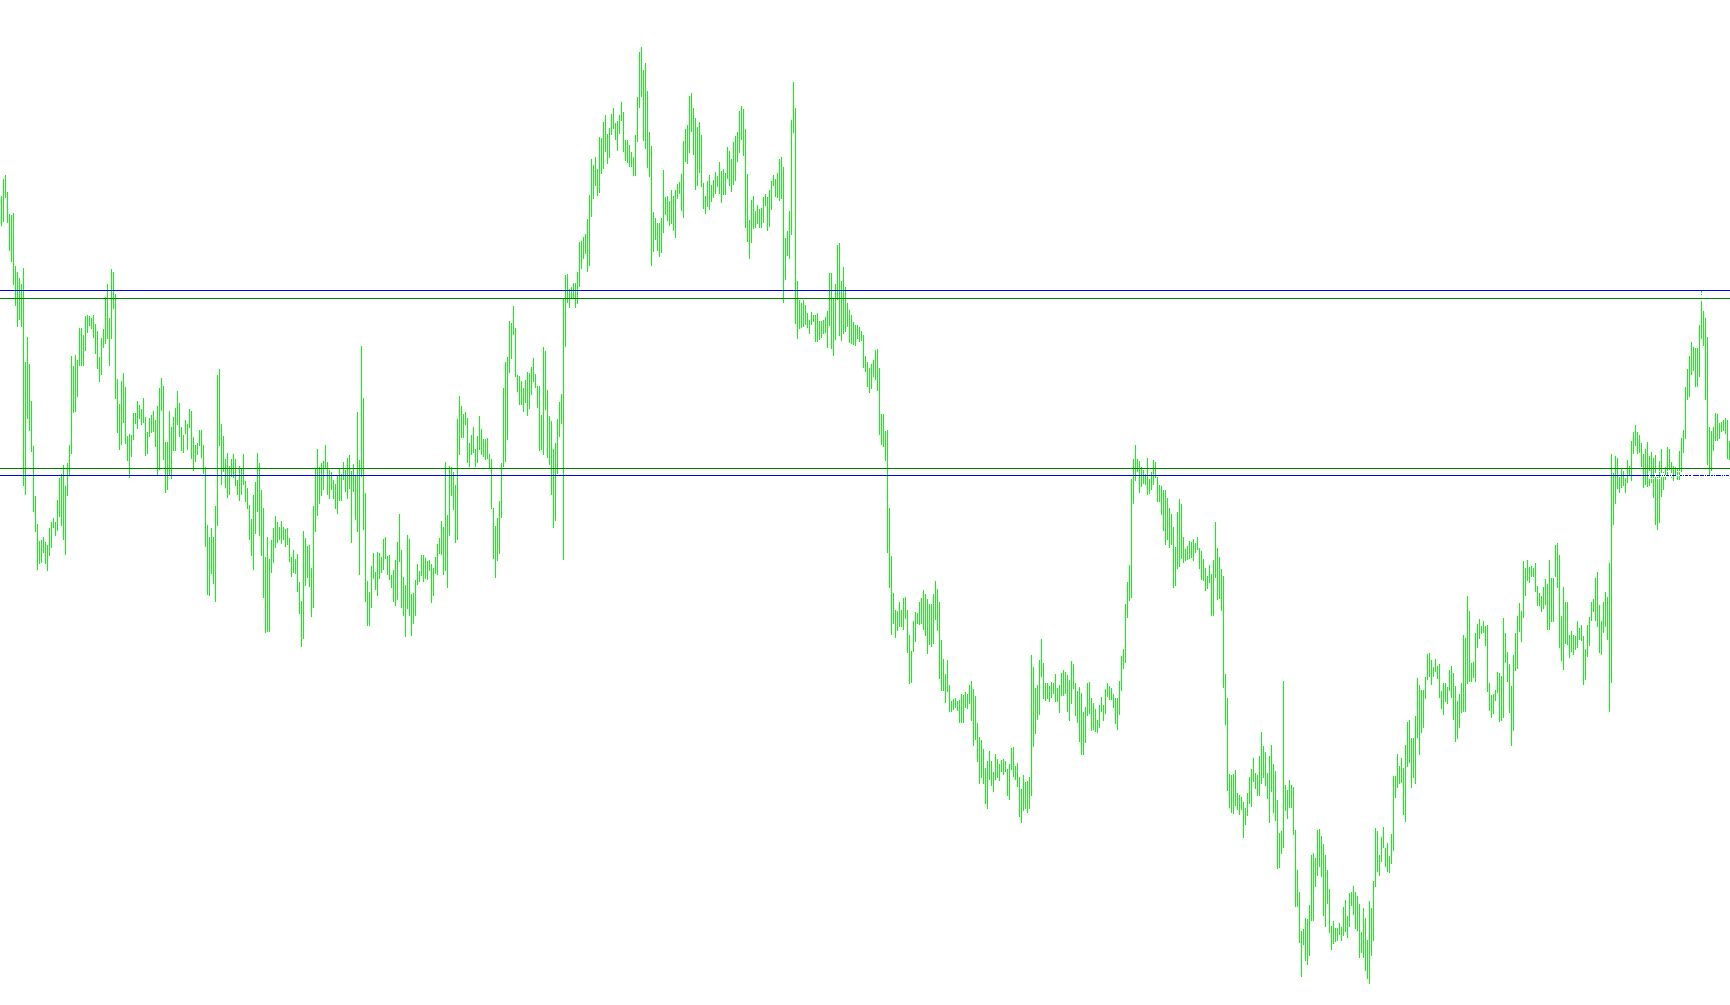
This tool is designed to provide visual guidance for traders by identifying key price levels on a chart based on recent historical data. It simplifies market analysis by automatically drawing lines that represent significant boundaries and potential entry zones.
How the Logic Works
The script functions by constantly scanning a specific window of past price action (the "Lookback Period"). Based on this history, it calculates four distinct types of levels:
1. Identifying Historical Boundaries The tool first scans the recent price movement to find the highest peak and the lowest valley reached during the set lookback period. It then draws two blue lines on your chart:
- High Line: Marks the absolute ceiling reached recently.
- Low Line: Marks the absolute floor reached recently.
2. Calculating Action Zones Beyond just showing where the price has been, the script calculates specific "action" levels to help identify potential trading opportunities:
- The Buy Line (Green): This is calculated by taking the recent "floor" (Low Line) and adding a small buffer amount. This represents a zone where traders might look for a buying opportunity if the price stabilizes or bounces off the bottom.
- The Sell Line (Red): This is calculated by taking the recent "ceiling" (High Line) and subtracting a small buffer amount. This represents a zone where traders might watch for selling opportunities as the price approaches the top.
Visual Feedback
To ensure the information is easy to read, the script provides two types of visual aids:
- Dynamic Labels: Text labels appear on the chart to clearly identify what each line represents (e.g., "LOW Plus Buy line" or "HIGH Minus Sell line").
- Horizontal Lines: Solid lines are drawn across the screen so you can easily see at a glance where these price boundaries sit relative to the current live price.
- On-Screen Commentary: If enabled, the tool also displays a text summary in the corner of your chart, providing the exact numerical values for both the Buy and Sell levels.
In essence, this script automates the tedious task of identifying recent price extremes and provides clear, color-coded visual markers to help you decide where the "ceiling" and "floor" of the current market movement are located.
//+------------------------------------------------------------------+
//|                                                        Lines_HiLo.mq4 |
//|
//|
//+------------------------------------------------------------------+
#property copyright "TradeForex"
#property link      ""

#property indicator_chart_window


extern int Lookback_Period = 15;
extern int Buy_At_Low_Plus = 20;
extern int Sell_At_High_Minus = 20;


extern bool ViewComment = true;
double period_Low=0;
double period_High=0;
double Period_Low_Line;
double Period_High_Line;
double Buy_Line=0;
double Sell_Line=0;
double BuyAt = 0;
double SellAt =0;
double HighAt = 0;
double LowAt =0;

//+------------------------------------------------------------------+
//| Custom indicator initialization function                         |
//+------------------------------------------------------------------+
int init()
{


}


//+------------------------------------------------------------------+
//| Custor indicator deinitialization function                       |
//+------------------------------------------------------------------+
int deinit()
{
   ObjectDelete("BuyAt Label");
   ObjectDelete("BuyAt Line");
   ObjectDelete("SellAt Label");
   ObjectDelete("SellAt Line");


   return(0);
}

//+------------------------------------------------------------------+
//| Custom indicator iteration function                              |
//+------------------------------------------------------------------+
int start()
{

         period_High =High[Highest(NULL,0,MODE_HIGH,Lookback_Period,1)];
         period_Low =Low[Lowest(NULL,0,MODE_LOW,Lookback_Period,1)];
        Period_Low_Line =  (period_Low );
        Period_High_Line =  (period_High );
         Buy_Line =  (period_Low + Buy_At_Low_Plus * Point );
         Sell_Line =  (period_High - Sell_At_High_Minus * Point );

   if (ViewComment==true){

   Comment("Buy at break of = ",Buy_Line, "  Sell at break of =  ",Sell_Line);
      }


   {

      SetLevel("High Line", Period_High_Line, Blue); //Blue
      SetLevel("Low Line", Period_Low_Line, Blue); //Blue

      SetLevel("LOW Plus Buy line", Buy_Line, Green); //Green
      SetLevel("HIGH Minus Sell line", Sell_Line, Green); //Red


   }


   return(0);
}


//+------------------------------------------------------------------+
//| Helper                                                           |
//+------------------------------------------------------------------+
void SetLevel(string text, double level, color col1)
{
   string labelname= text + " Label";
   string linename= text + " Line";

   if (ObjectFind(labelname) != 0) {
      ObjectCreate(labelname, OBJ_TEXT, 0, Time[20], level);
      ObjectSetText(labelname, " " + text, 8, "Arial", White);
   }
   else {
      ObjectMove(labelname, 0, Time[20], level);
   }

   if (ObjectFind(linename) != 0) {
      ObjectCreate(linename, OBJ_HLINE, 0, Time[40], level);
      ObjectSet(linename, OBJPROP_STYLE, STYLE_SOLID);
      ObjectSet(linename,OBJPROP_LEVELWIDTH, 5);
      ObjectSet(linename, OBJPROP_COLOR, col1);

      }
   else {
      ObjectMove(linename, 0, Time[40], level);

   }
}
Comments