HiLo Lines
Download script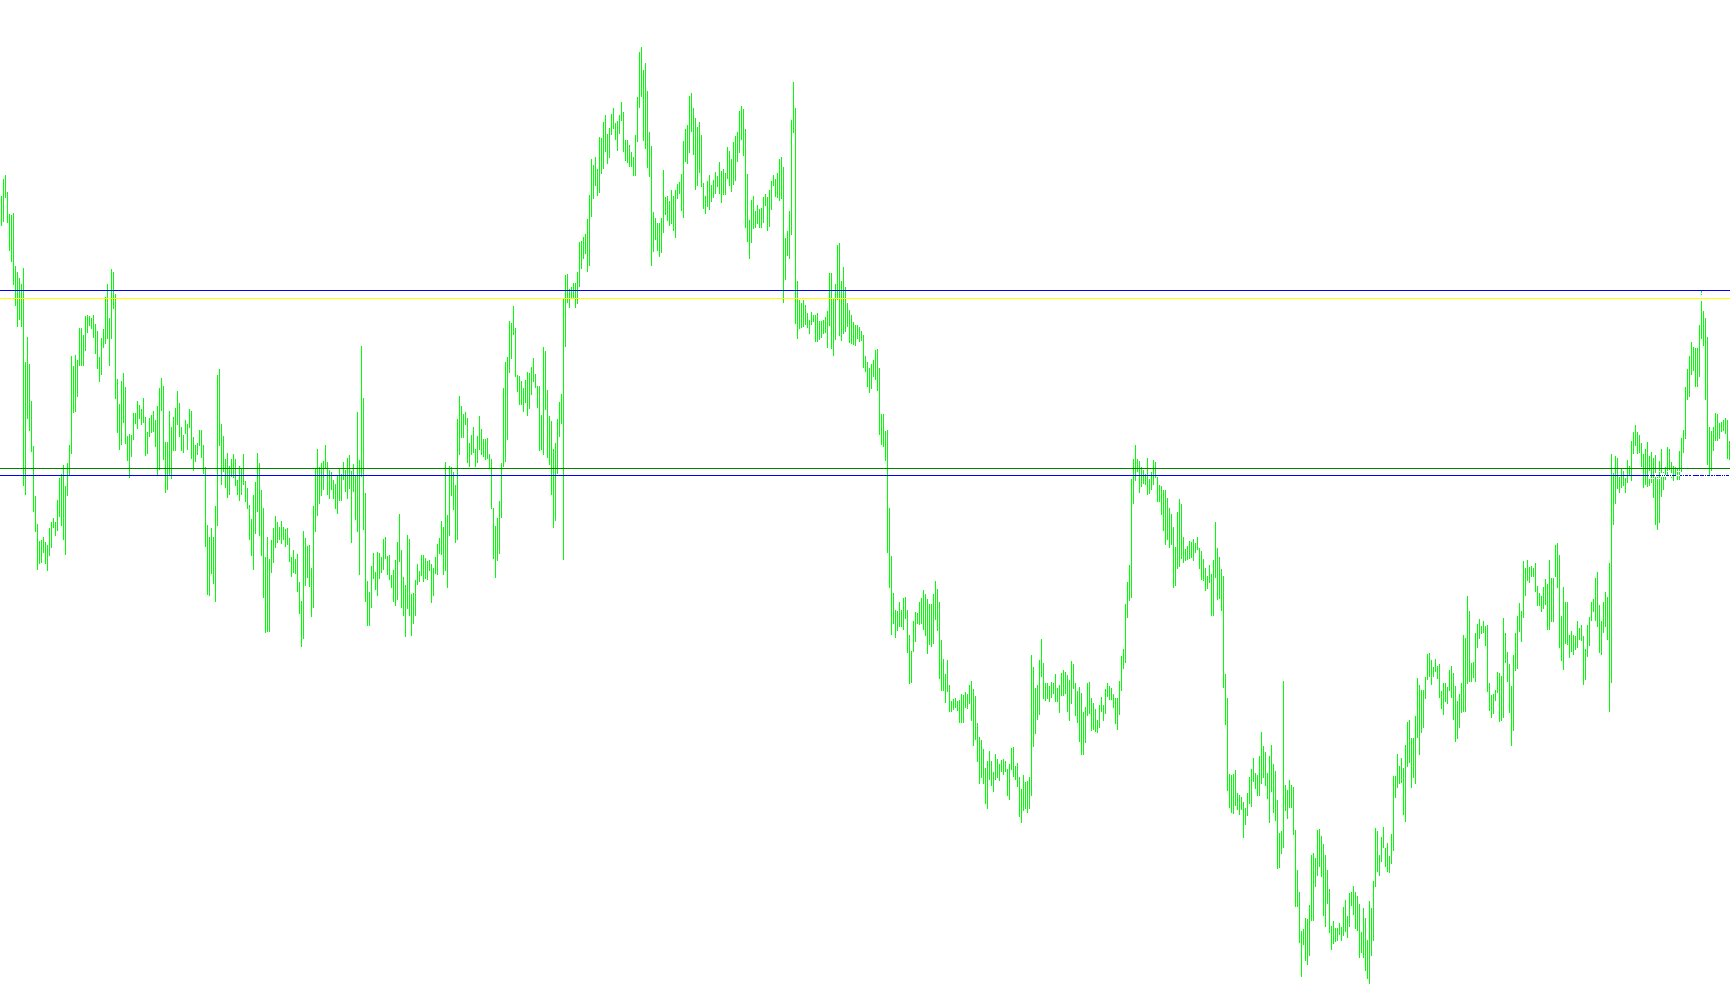
This script is designed as a visual aid for traders to identify significant price boundaries and potential entry points on a MetaTrader chart. It simplifies market analysis by automatically calculating historical highs and lows over a specific timeframe and projecting "Buy" and "Sell" zones based on those levels.
Core Functionality
The logic operates by scanning a set number of previous candles (defined by the user) to determine the highest and lowest price points reached during that period. Once these extreme points are identified, the script projects four distinct horizontal lines on your chart:
- The Baseline Levels: It marks the actual historical high and low points from the lookback period. These serve as the primary boundaries of recent market activity.
- The Dynamic Entry Lines: The script calculates two secondary lines that act as "buffer" zones:
- Buy Line: This is positioned slightly above the historical low. It suggests a potential area to watch for a reversal or entry when the price stabilizes at the bottom of its recent range.
- Sell Line: This is positioned slightly below the historical high. It identifies a zone where the price may face resistance, suggesting a potential point to look for a downward move.
Visual Interface
To ensure the information is easy to read at a glance, the script provides several visual enhancements:
- Color-Coded Lines: Each level is assigned a specific color (such as Blue, Green, and Yellow/Red) to help differentiate between historical boundaries and actionable trade zones.
- Text Labels: The script automatically places text labels on the chart next to each line, ensuring you always know exactly what each level represents without having to hover over it.
- On-Screen Commentary: If enabled, the script provides a real-time text summary in the corner of your screen, explicitly stating the exact price levels at which you should monitor for "Buy" and "Sell" opportunities.
Summary for Traders
Essentially, this tool automates the process of "drawing lines" on your chart. Instead of manually guessing where the recent highs and lows are, the script calculates them instantly and provides you with specific targets. It highlights where the price has been in the past and creates a clear visual roadmap for where it might move next based on those historical extremes.
//+------------------------------------------------------------------+
//|                                                        Lines_HiLo.mq4 |
//|
//|
//+------------------------------------------------------------------+
#property copyright "TradeForex"
#property link      ""

#property indicator_chart_window


extern int Lookback_Period = 15;
extern int Buy_At_Low_Plus = 20;
extern int Sell_At_High_Minus = 20;


extern bool ViewComment = true;
double period_Low=0;
double period_High=0;
double Period_Low_Line;
double Period_High_Line;
double Buy_Line=0;
double Sell_Line=0;
double BuyAt = 0;
double SellAt =0;
double HighAt = 0;
double LowAt =0;

//+------------------------------------------------------------------+
//| Custom indicator initialization function                         |
//+------------------------------------------------------------------+
int init()
{


}


//+------------------------------------------------------------------+
//| Custor indicator deinitialization function                       |
//+------------------------------------------------------------------+
int deinit()
{
   ObjectDelete("BuyAt Label");
   ObjectDelete("BuyAt Line");
   ObjectDelete("SellAt Label");
   ObjectDelete("SellAt Line");


   return(0);
}

//+------------------------------------------------------------------+
//| Custom indicator iteration function                              |
//+------------------------------------------------------------------+
int start()
{

         period_High =High[Highest(NULL,0,MODE_HIGH,Lookback_Period,1)];
         period_Low =Low[Lowest(NULL,0,MODE_LOW,Lookback_Period,1)];
        Period_Low_Line =  (period_Low );
        Period_High_Line =  (period_High );
         Buy_Line =  (period_Low + Buy_At_Low_Plus * Point );
         Sell_Line =  (period_High - Sell_At_High_Minus * Point );

   if (ViewComment==true){

   Comment("Buy at break of = ",Buy_Line, "  Sell at break of =  ",Sell_Line);
      }


   {

      SetLevel("High Line", Period_High_Line, Blue); //Blue
      SetLevel("Low Line", Period_Low_Line, Blue); //Blue

      SetLevel("LOW Plus Buy line", Buy_Line, Green); //Green
      SetLevel("HIGH Minus Sell line", Sell_Line, Yellow); //Red


   }


   return(0);
}


//+------------------------------------------------------------------+
//| Helper                                                           |
//+------------------------------------------------------------------+
void SetLevel(string text, double level, color col1)
{
   string labelname= text + " Label";
   string linename= text + " Line";

   if (ObjectFind(labelname) != 0) {
      ObjectCreate(labelname, OBJ_TEXT, 0, Time[20], level);
      ObjectSetText(labelname, " " + text, 8, "Arial", White);
   }
   else {
      ObjectMove(labelname, 0, Time[20], level);
   }

   if (ObjectFind(linename) != 0) {
      ObjectCreate(linename, OBJ_HLINE, 0, Time[40], level);
      ObjectSet(linename, OBJPROP_STYLE, STYLE_SOLID);
      ObjectSet(linename,OBJPROP_LEVELWIDTH, 5);
      ObjectSet(linename, OBJPROP_COLOR, col1);

      }
   else {
      ObjectMove(linename, 0, Time[40], level);

   }
}
Comments