DPO_v2
Download script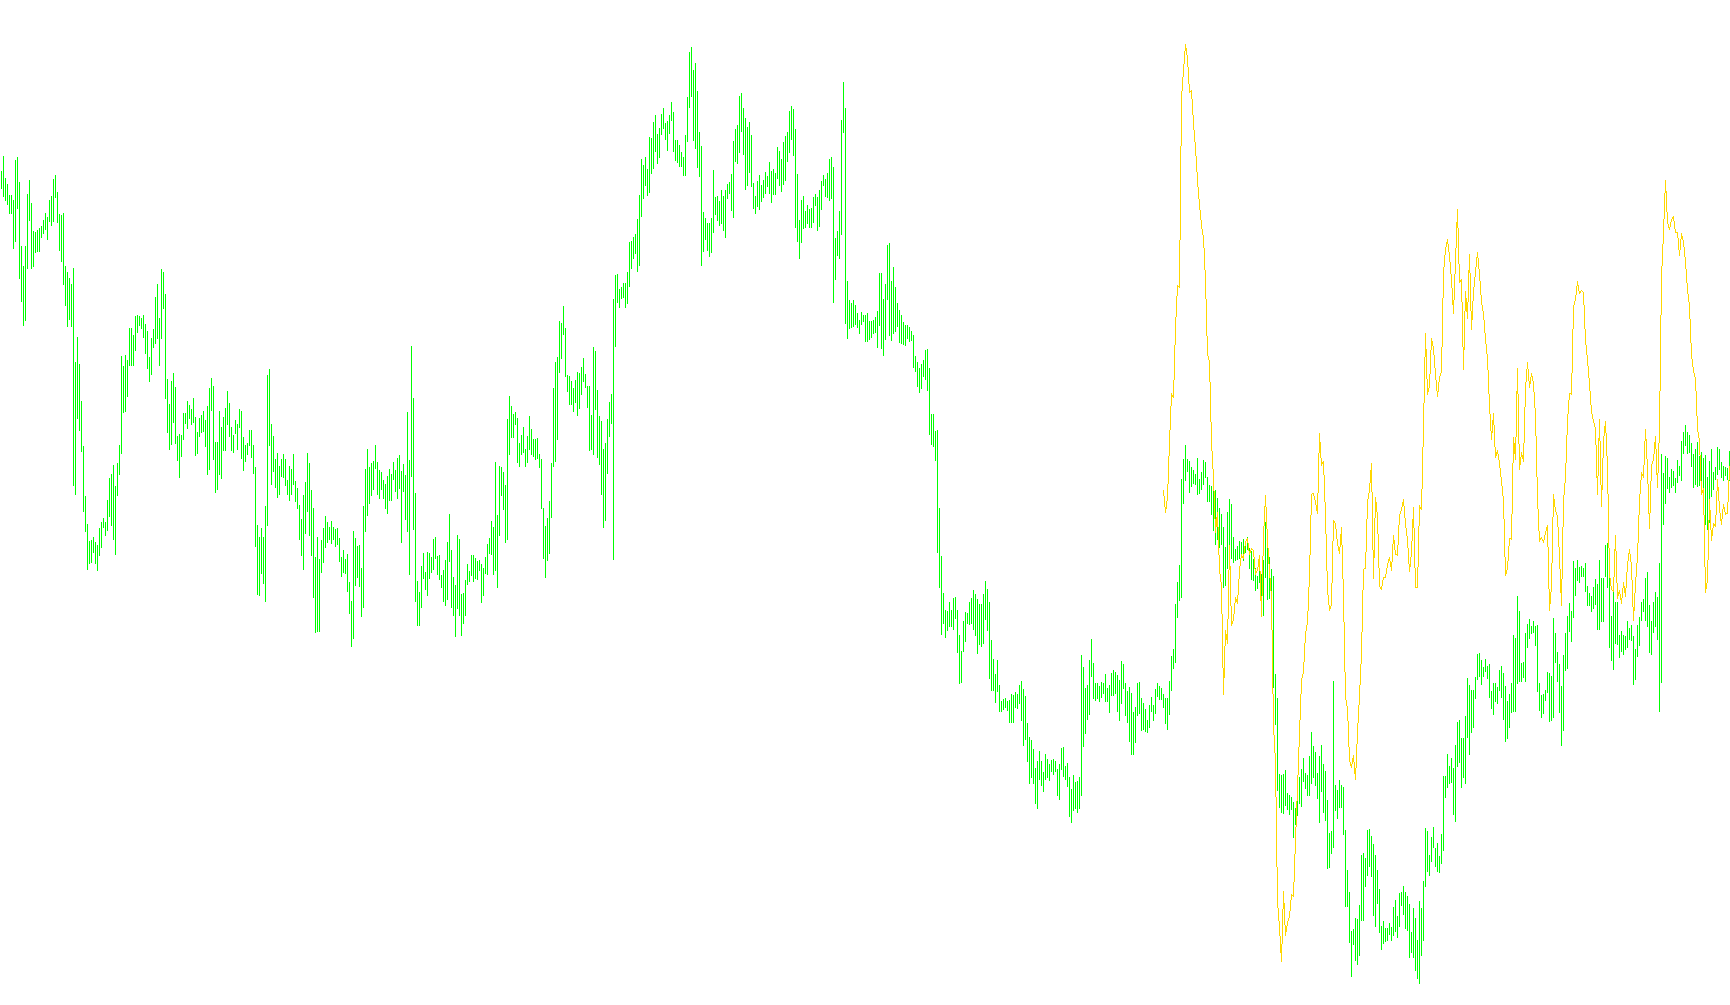
This tool is designed to provide traders with a visual representation of market momentum by highlighting the difference between current prices and historical averages. Rather than showing you the price itself, it isolates the "gap" between what is happening right now and what has been the standard behavior over a specific period.
How It Works
The logic operates on a simple but effective principle: it compares the most recent closing price of an asset against its Simple Moving Average (SMA). By subtracting the average price from the current price, the tool produces a "Conversion" line.
- When the line is above zero: It indicates that the current market price is trading higher than its recent average, suggesting upward momentum or bullish sentiment.
- When the line is below zero: It suggests that the current price is trading lower than its recent average, which may indicate downward pressure or bearish sentiment.
Key Features
- Customizable Sensitivity: The script allows you to define a specific "period" (the look-back timeframe). A shorter period will make the line more sensitive to quick price fluctuations, while a longer period will smooth out the data to show broader trends.
- Visual Clarity: It is designed to appear in a separate window below your main chart. This ensures that it doesn't clutter your price action but instead provides a dedicated space to track momentum trends independently.
- Data Efficiency: The script is programmed to focus on a specific number of historical bars, ensuring that the chart remains clean and only displays the most relevant recent data for your analysis.
Summary for Traders
Think of this indicator as a "momentum tracker." Instead of looking at whether the price is going up or down in isolation, it tells you how much the current price is deviating from its "norm." It helps identify when a trend is gaining strength or starting to lose steam by showing you the distance between today's reality and yesterday’s average.
/*-----------------------------+
|			       |
| Shared by www.Aptrafx.com    |
|			       |
+------------------------------*/

//+------------------------------------------------------------------+
//| DPO.mq4
//| Ramdass - Conversion only
//+------------------------------------------------------------------+

#property indicator_separate_window
#property indicator_buffers 1
#property indicator_color1 Blue


extern int x_prd=14;
extern int CountBars=300;
//---- buffers
double dpo[];


//+------------------------------------------------------------------+
//| Custom indicator initialization function                         |
//+------------------------------------------------------------------+
int init()
  {
   string short_name;
//---- indicator line
   IndicatorBuffers(1);
   SetIndexStyle(0,DRAW_LINE);
   SetIndexBuffer(0,dpo);
//----
   return(0);
  }
//+------------------------------------------------------------------+
//| DPO                                                              |
//+------------------------------------------------------------------+
int start()
  {
   if (CountBars>=Bars) CountBars=Bars;
   SetIndexDrawBegin(0,Bars-CountBars+x_prd+1);
   int i,counted_bars=IndicatorCounted();
   double t_prd;
//----
   if(Bars<=x_prd) return(0);
//---- initial zero
   if(counted_bars<x_prd)
   {
      for(i=1;i<=x_prd;i++) dpo[CountBars-i]=0.0;
   }
//----
   i=CountBars-x_prd-1;
   t_prd=x_prd/2+1;

   while(i>=0)
     {
     dpo[i]=Close[i]-iMA(NULL,0,x_prd,t_prd,MODE_SMA,PRICE_CLOSE,i);


      i--;
     }
   return(0);
  }
//+------------------------------------------------------------------+
Comments