MT4-Cams-Pivots
Download script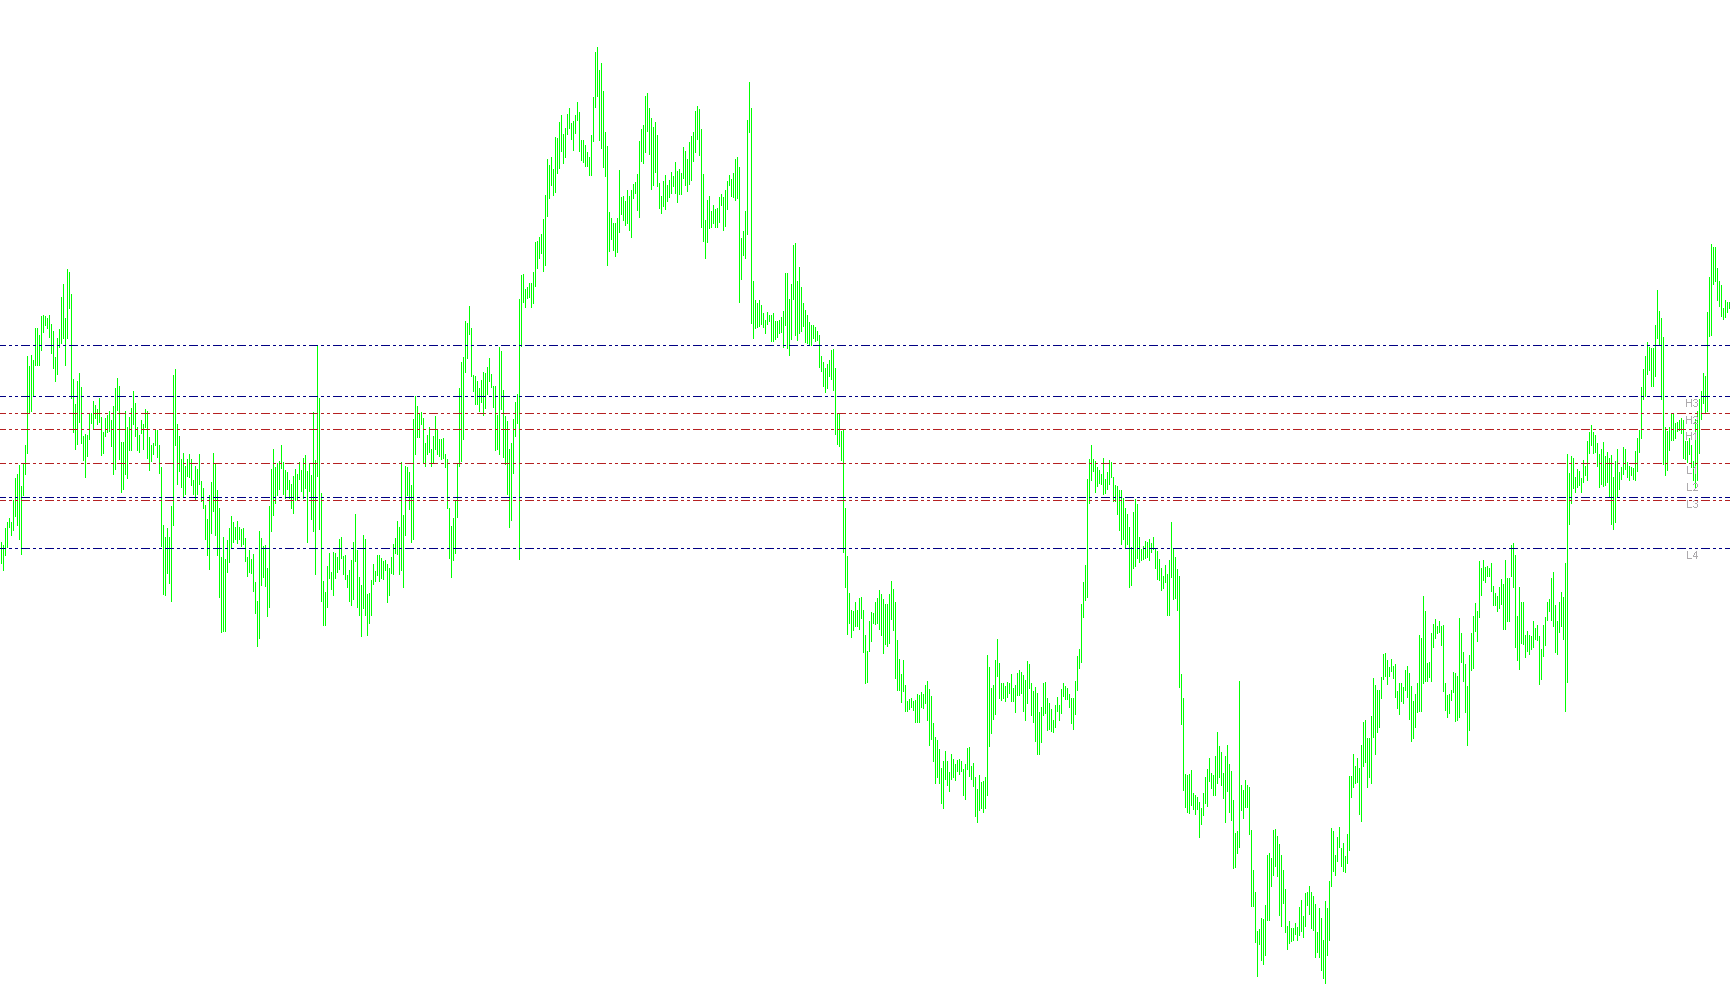
This script is designed for the MetaTrader 4 platform to automatically calculate and display "Camarilla Pivots" on a trading chart. These are specific price levels used by traders to identify potential areas of support and resistance based on the previous day's price action.
Core Functionality
The script operates by analyzing historical price data from the preceding trading session to project key boundaries for the current day. Here is the breakdown of how it handles this logic:
1. Data Collection and Time Synchronization
- Timezone Adjustment: The script includes a setting to account for GMT offsets, ensuring that "today" and "yesterday" are identified correctly regardless of your local time.
- Price Scanning: It scans hourly data to pinpoint the exact opening, closing, highest, and lowest prices of the previous trading day. It specifically looks for the highest and lowest points reached during that specific 24-hour cycle.
2. Calculation Logic Once the high, low, and closing prices of yesterday are identified, the script applies a specific mathematical formula to generate eight distinct levels:
- High Range Levels (H1 - H4): These represent potential breakout points above yesterday's close. They are calculated by taking the difference between yesterday's high and low, adjusting it slightly, and adding it to the closing price at various fractions.
- Low Range Levels (L1 - L4): These represent potential support levels below yesterday's close. They are calculated by subtracting various fractions of the daily range from yesterday's closing price.
3. Visual Representation The script is designed to be highly visual and interactive:
- Automatic Drawing: It automatically draws horizontal lines across your chart for each of the eight Camarilla levels.
- Color Coding: To help traders distinguish between types of movements, different colors are assigned to different levels (e.g., Navy for higher/lower extremes and FireBrick for intermediate levels).
- Dynamic Labels: The script places text labels (like "H1", "L2", etc.) directly on the chart so you can identify each price level at a glance.
- Real-Time Updates: As new price data arrives, the script updates the positions of these lines and labels dynamically to reflect the most current calculations.
4. User Interface Elements
- On-Screen Comments: The script provides a text summary in the corner of the chart area, displaying the calculated high, low, and closing prices for the session, allowing for quick reference without needing to hover over the lines.
- Chart Compatibility: The tool includes a safety check to ensure it is only used on intraday charts (periods shorter than one day), as the logic relies on daily price transitions.
//+------------------------------------------------------------------+
//|                                             Camarilla Pivots.mq4 |
//|  modified from Pivots.mq4 found on MT yahoo group by forex2stay  |
//|                                                                  |
//+------------------------------------------------------------------+
#property copyright "forex2stay"
#property link      " "

#property indicator_chart_window
#property indicator_buffers 1
#property indicator_color1 EMPTY


extern bool camarilla = true;
extern int gmt_offset = 7;

double day_high=0;
double day_low=0;
double yesterday_high=0;
double yesterday_open=0;
double yesterday_low=0;
double yesterday_close=0;
double today_open=0;
double today_high=0;
double today_low=0;
double P=0;
double wP=0;
double Q=0;
double CH4,CH3,CH2,CH1,CL4,CL3,CL2,CL1;
double nQ=0;
double nD=0;
double D=0;
double rates_h1[2][6];
double ExtMapBuffer1[];
//+------------------------------------------------------------------+
//| Custom indicator initialization function                         |
//+------------------------------------------------------------------+
int init(){
   IndicatorBuffers(4);
   SetIndexStyle(0,DRAW_ARROW);
   SetIndexArrow(0,159);
   SetIndexBuffer(0, ExtMapBuffer1);

   //---- indicators
  CH4=0; CH3=0; CH2=0; CH1=0; CL4=0; CL3=0; CL2=0; CL1=0;


   //----
   return(0);
}
//+------------------------------------------------------------------+
//| Custor indicator deinitialization function                       |
//+------------------------------------------------------------------+
int deinit(){
   //---- TODO: add your code here
   ObjectDelete("CH4 Label");
   ObjectDelete("CH4 Line");
   ObjectDelete("CH3 Label");
   ObjectDelete("CH3 Line");
   ObjectDelete("CH2 Label");
   ObjectDelete("CH2 Line");
   ObjectDelete("CH1 Label");
   ObjectDelete("CH1 Line");
   ObjectDelete("CL1 Label");
   ObjectDelete("CL2 Line");
   ObjectDelete("CL3 Label");
   ObjectDelete("CL3 Line");
   ObjectDelete("CL4 Label");
   ObjectDelete("CL4 Line");
   //----
   return(0);
}
//+------------------------------------------------------------------+
//| Custom indicator iteration function                              |
//+------------------------------------------------------------------+
int start(){

//---- TODO: add your code here

//---- exit if period is greater than daily charts
   if(Period() > 1440){
      Print("Error - Chart period is greater than 1 day.");
      return(-1); // then exit
   }

//---- Get new daily prices
   ArrayCopyRates(rates_h1, Symbol(), PERIOD_H1);
   for(int i=0;i < 24;i++){
      if((TimeHour(rates_h1[i][0]) - gmt_offset) == 0){
         yesterday_open = rates_h1[i+24][1];
         yesterday_close = rates_h1[i][1];
         today_open = rates_h1[i][1];
         yesterday_high = rates_h1[i+1][3];
         yesterday_low = rates_h1[i+1][2];
         for(int j=0;j < 24;j++){
            if(rates_h1[i+j][3] > yesterday_high) yesterday_high = rates_h1[i+j][3];
            if(rates_h1[i+j][2] < yesterday_low) yesterday_low = rates_h1[i+j][2];
         }
         day_high = rates_h1[i][3];
         day_low = rates_h1[i][2];
         while(i>=0){
            if(rates_h1[i][3] > day_high) day_high = rates_h1[i][3];
            if(rates_h1[i][2] < day_low) day_low = rates_h1[i][2];
            i--;
         }
         break;
      }
   }


//---- Calculate Pivots

   CH4 = (((yesterday_high-yesterday_low)* 1.1)/2)+ yesterday_close;
	CH3 = (((yesterday_high-yesterday_low)* 1.1)/4)+ yesterday_close;
	CH2 = (((yesterday_high-yesterday_low)* 1.1)/6)+ yesterday_close;
	CH1 = (((yesterday_high-yesterday_low)* 1.1)/12)+ yesterday_close;
	CL1 = yesterday_close-(((yesterday_high-yesterday_low) * 1.1)/12);
	CL2 = yesterday_close-(((yesterday_high-yesterday_low) * 1.1)/6);
	CL3 = yesterday_close-(((yesterday_high-yesterday_low)* 1.1)/4);
	CL4 = yesterday_close-(((yesterday_high-yesterday_low) * 1.1)/2);

   if (Q > 5) {
	  nQ = Q;
   } else {
	  nQ = Q*10000;
   }

   if (D > 5){
	  nD = D;
   } else {
	  nD = D*10000;
   }


   Comment("High= ",yesterday_high,"    Previous Days Range= ",nQ,"\nLow= ",yesterday_low,"    Current Days Range= ",nD,"\nClose= ",yesterday_close);
   //Comment("High= ",yesterday_high,"    Previous Days Range= ",nQ,"\nLow= ",yesterday_low,"\nClose= ",yesterday_close);
   //Comment("High= "+yesterday_high+"    Low= "+yesterday_low+"    Open= "+today_open);

   //---- Set line labels on chart window

   //----- Camarilla Lines

   if (camarilla==true){
      if(ObjectFind("CH4label") != 0){
         ObjectCreate("CH4label", OBJ_TEXT, 0, Time[20], CH4);
         ObjectSetText("CH4label", " H4", 8, "Arial", EMPTY);
      } else {
         ObjectMove("CH4label", 0, Time[20], CH4);
      }

      if(ObjectFind("CH3 label") != 0){
         ObjectCreate("CH3 label", OBJ_TEXT, 0, Time[20], CH3);
         ObjectSetText("CH3 label", " H3", 8, "Arial", DarkGray);
      } else {
         ObjectMove("CH3 label", 0, Time[20], CH3);
      }

      if(ObjectFind("CH2 label") != 0){
         ObjectCreate("CH2 label", OBJ_TEXT, 0, Time[20], CH2);
         ObjectSetText("CH2 label", " H2", 8, "Arial", DarkGray);
      } else {
         ObjectMove("CH2 label", 0, Time[20], CH2);
      }

      if(ObjectFind("CH1 label") != 0){
         ObjectCreate("CH1 label", OBJ_TEXT, 0, Time[20], CH1);
         ObjectSetText("CH1 label", " H1", 8, "Arial", DarkGray);
      } else {
         ObjectMove("CH1 label", 0, Time[20], CH1);
      }

      if(ObjectFind("CL1 label") != 0){
         ObjectCreate("CL1 label", OBJ_TEXT, 0, Time[20], CL1);
         ObjectSetText("CL1 label", " L1", 8, "Arial", DarkGray);
      } else {
         ObjectMove("CL1 label", 0, Time[20], CL1);
      }

      if(ObjectFind("CL2 label") != 0){
         ObjectCreate("CL2 label", OBJ_TEXT, 0, Time[20], CL2);
         ObjectSetText("CL2 label", " L2", 8, "Arial", DarkGray);
      } else {
         ObjectMove("CL2 label", 0, Time[20], CL2);
      }

      if(ObjectFind("L3 label") != 0){
         ObjectCreate("L3 label", OBJ_TEXT, 0, Time[20], CL3);
         ObjectSetText("L3 label", " L3", 8, "Arial", DarkGray);
      } else {
         ObjectMove("L3 label", 0, Time[20], CL3);
      }

      if(ObjectFind("L4 label") != 0){
         ObjectCreate("L4 label", OBJ_TEXT, 0, Time[20], CL4);
         ObjectSetText("L4 label", " L4", 8, "Arial", DarkGray);
      } else {
         ObjectMove("L4 label", 0, Time[20], CL4);
      }

//---- Draw Camarilla lines on Chart
      if(ObjectFind("CH4 line") != 0){
         ObjectCreate("CH4 line", OBJ_HLINE, 0, Time[40], CH4);
         ObjectSet("CH4 line", OBJPROP_STYLE, STYLE_DASHDOTDOT);
         ObjectSet("CH4 line", OBJPROP_COLOR, Navy);
      } else {
         ObjectMove("CH4 line", 0, Time[40], CH4);
      }

      if(ObjectFind("CH3 line") != 0){
         ObjectCreate("CH3 line", OBJ_HLINE, 0, Time[40], CH3);
         ObjectSet("CH3 line", OBJPROP_STYLE, STYLE_DASHDOTDOT);
         ObjectSet("CH3 line", OBJPROP_COLOR, Navy);
      } else {
         ObjectMove("CH3 line", 0, Time[40], CH3);
      }

      if(ObjectFind("CH2 line") != 0){
         ObjectCreate("CH2 line", OBJ_HLINE, 0, Time[40], CH2);
         ObjectSet("CH2 line", OBJPROP_STYLE, STYLE_DASHDOTDOT);
         ObjectSet("CH2 line", OBJPROP_COLOR, FireBrick);
      } else {
         ObjectMove("CH2 line", 0, Time[40], CH2);
      }

      if(ObjectFind("CH1 line") != 0){
         ObjectCreate("CH1 line", OBJ_HLINE, 0, Time[40], CH1);
         ObjectSet("CH1 line", OBJPROP_STYLE, STYLE_DASHDOTDOT);
         ObjectSet("CH1 line", OBJPROP_COLOR, FireBrick);
      } else {
         ObjectMove("CH1 line", 0, Time[40], CH1);
      }

      if(ObjectFind("CL1 line") != 0){
         ObjectCreate("CL1 line", OBJ_HLINE, 0, Time[40], CL1);
         ObjectSet("CL1 line", OBJPROP_STYLE, STYLE_DASHDOTDOT);
         ObjectSet("CL1 line", OBJPROP_COLOR, FireBrick);
      } else {
         ObjectMove("CL1 line", 0, Time[40], CL1);
      }

      if(ObjectFind("CL2 line") != 0){
         ObjectCreate("CL2 line", OBJ_HLINE, 0, Time[40], CL2);
         ObjectSet("CL2 line", OBJPROP_STYLE, STYLE_DASHDOTDOT);
         ObjectSet("CL2 line", OBJPROP_COLOR, FireBrick);
      } else {
         ObjectMove("CL3 line", 0, Time[40], CL2);
      }

      if(ObjectFind("CL3 line") != 0){
         ObjectCreate("CL3 line", OBJ_HLINE, 0, Time[40], CL3);
         ObjectSet("CL3 line", OBJPROP_STYLE, STYLE_DASHDOTDOT);
         ObjectSet("CL3 line", OBJPROP_COLOR, Navy);
      } else {
         ObjectMove("CL3 line", 0, Time[40], CL3);
      }

      if(ObjectFind("CL4 line") != 0){
         ObjectCreate("CL4 line", OBJ_HLINE, 0, Time[40], CL4);
         ObjectSet("CL4 line", OBJPROP_STYLE, STYLE_DASHDOTDOT);
         ObjectSet("CL4 line", OBJPROP_COLOR, Navy);
      } else {
         ObjectMove("CL4 line", 0, Time[40], CL4);
      }
   }
//-------End of Draw Camarilla Lines

//---- End Of Program
   return(0);
}
//+------------------------------------------------------------------+
Comments