MT4-Cams-Pivots_v2
Download script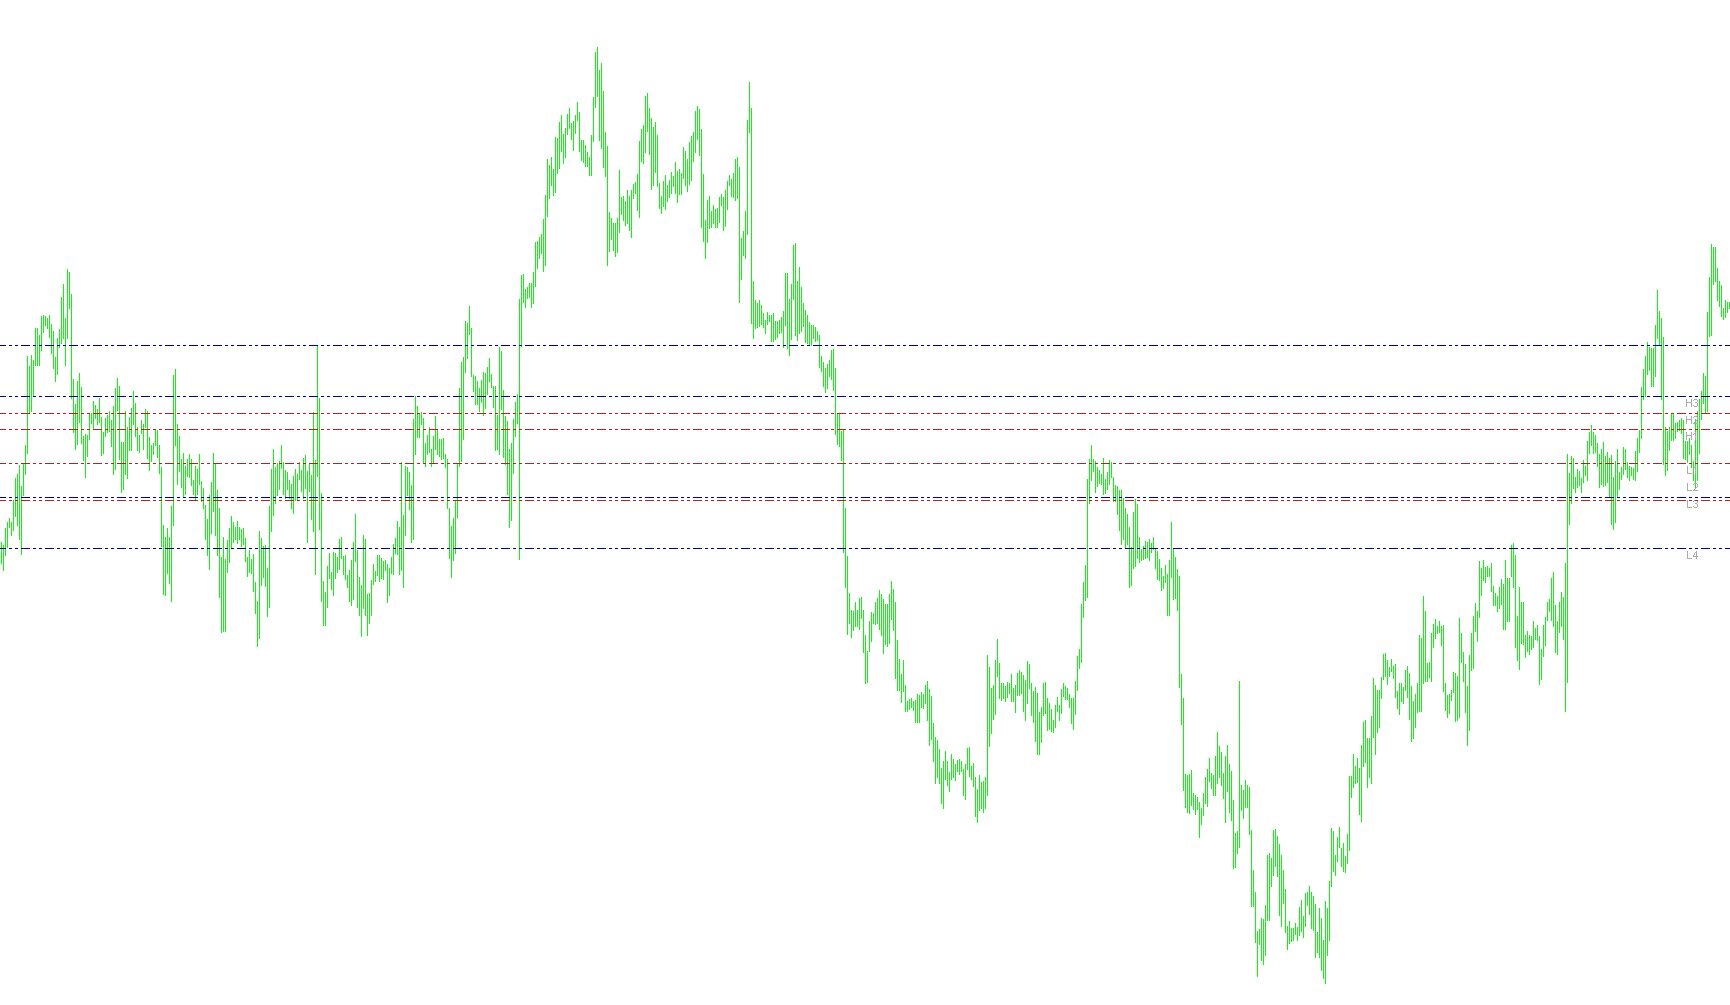
This script is designed for the MetaTrader 4 platform to automatically calculate and display Camarilla Pivot Points on a trading chart. These pivot points are technical analysis levels used by traders to identify potential support and resistance zones based on price action from previous sessions.
Core Functionality
The script follows a logical sequence to provide real-time visual data for your trading screen:
1. Timeframe Validation Before performing any calculations, the script checks the timeframe of your current chart. It is specifically designed for intraday analysis; therefore, it will prevent itself from running if the chart is set to a period larger than one day (e.g., Weekly or Monthly charts).
2. Data Collection and Analysis The script systematically scans historical price data to gather essential information:
- Yesterday's Range: It identifies the highest price reached, the lowest price hit, and the closing price of the previous trading day.
- Timezone Synchronization: It includes a customizable "GMT Offset" to ensure that it correctly identifies the start and end of days based on your local time or specific exchange time.
- Current Day Tracking: It also monitors the high and low prices of the current ongoing day.
3. The Camarilla Calculation Logic Once the previous day's data is collected, the script applies a specific mathematical formula to generate eight distinct price levels:
- Resistance Levels (H1–H4): These are calculated above the previous day's close. They represent potential ceilings where the market might struggle to break upward.
- Support Levels (L1–L4): These are calculated below the previous day's close. They represent potential floors where the market might find buying interest.
The script utilizes a multiplier (set at 1.1 in this specific logic) applied to the range between yesterday's high and low to determine exactly where these lines should sit.
4. Visual Display and User Interface After calculating the prices, the script updates your chart visually:
- Dynamic Labeling: It creates text labels on the chart (e.g., "H1", "L2") so you can easily identify each level at a glance.
- Automated Drawing: It draws horizontal dashed lines across the chart at the calculated prices. These lines are color-coded to distinguish between different types of levels (using Navy and FireBrick colors).
- Live Dashboard: The script provides a text summary in the corner of the screen, displaying the current high, low, and closing price, along with the calculated range for both the previous and current days.
User Experience Summary
For a trader, this means you don't have to manually calculate complex pivot formulas every morning. As soon as the script is active, it automatically identifies "zones of interest" based on yesterday's volatility, drawing them clearly on your screen so you can see where potential price reversals or breakouts might occur.
//+------------------------------------------------------------------+
//|                                             Camarilla Pivots.mq4 |
//|  modified from Pivots.mq4 found on MT yahoo group by forex2stay  |
//|                                                                  |
//+------------------------------------------------------------------+
#property copyright "forex2stay"
#property link      " "
//----
#property indicator_chart_window
#property indicator_buffers 1
#property indicator_color1 EMPTY
//----
extern bool camarilla=true;
extern int gmt_offset=7;
//----
double day_high=0;
double day_low=0;
double yesterday_high=0;
double yesterday_open=0;
double yesterday_low=0;
double yesterday_close=0;
double today_open=0;
double today_high=0;
double today_low=0;
double P=0;
double wP=0;
double Q=0;
double CH4,CH3,CH2,CH1,CL4,CL3,CL2,CL1;
double nQ=0;
double nD=0;
double D=0;
double rates_h1[2][6];
double ExtMapBuffer1[];
//+------------------------------------------------------------------+
//| Custom indicator initialization function                         |
//+------------------------------------------------------------------+
  int init()
  {
   IndicatorBuffers(4);
   SetIndexStyle(0,DRAW_ARROW);
   SetIndexArrow(0,159);
   SetIndexBuffer(0, ExtMapBuffer1);
//---- indicators
   CH4=0; CH3=0; CH2=0; CH1=0; CL4=0; CL3=0; CL2=0; CL1=0;
//----
   return(0);
  }
//+------------------------------------------------------------------+
//| Custor indicator deinitialization function                       |
//+------------------------------------------------------------------+
  int deinit()
  {
//---- TODO: add your code here
   ObjectDelete("CH4 Label");
   ObjectDelete("CH4 Line");
   ObjectDelete("CH3 Label");
   ObjectDelete("CH3 Line");
   ObjectDelete("CH2 Label");
   ObjectDelete("CH2 Line");
   ObjectDelete("CH1 Label");
   ObjectDelete("CH1 Line");
   ObjectDelete("CL1 Label");
   ObjectDelete("CL2 Line");
   ObjectDelete("CL3 Label");
   ObjectDelete("CL3 Line");
   ObjectDelete("CL4 Label");
   ObjectDelete("CL4 Line");
//----
   return(0);
  }
//+------------------------------------------------------------------+
//| Custom indicator iteration function                              |
//+------------------------------------------------------------------+
  int start()
  {
//---- TODO: add your code here
//---- exit if period is greater than daily charts
     if(Period() > 1440)
     {
      Print("Error - Chart period is greater than 1 day.");
      return(-1); // then exit
     }
//---- Get new daily prices
   ArrayCopyRates(rates_h1, Symbol(), PERIOD_H1);
     for(int i=0;i < 24;i++)
     {
        if((TimeHour(rates_h1[i][0]) - gmt_offset)==0)
        {
         yesterday_open=rates_h1[i+24][1];
         yesterday_close=rates_h1[i][1];
         today_open=rates_h1[i][1];
         yesterday_high=rates_h1[i+1][3];
         yesterday_low=rates_h1[i+1][2];
           for(int j=0;j < 24;j++)
           {
            if(rates_h1[i+j][3] > yesterday_high) yesterday_high=rates_h1[i+j][3];
            if(rates_h1[i+j][2] < yesterday_low) yesterday_low=rates_h1[i+j][2];
           }
         day_high=rates_h1[i][3];
         day_low=rates_h1[i][2];
           while(i>=0)
           {
            if(rates_h1[i][3] > day_high) day_high=rates_h1[i][3];
            if(rates_h1[i][2] < day_low) day_low=rates_h1[i][2];
            i--;
           }
         break;
        }
     }
//---- Calculate Pivots
   CH4=(((yesterday_high-yesterday_low)* 1.1)/2)+ yesterday_close;
   CH3=(((yesterday_high-yesterday_low)* 1.1)/4)+ yesterday_close;
   CH2=(((yesterday_high-yesterday_low)* 1.1)/6)+ yesterday_close;
   CH1=(((yesterday_high-yesterday_low)* 1.1)/12)+ yesterday_close;
   CL1=yesterday_close-(((yesterday_high-yesterday_low) * 1.1)/12);
   CL2=yesterday_close-(((yesterday_high-yesterday_low) * 1.1)/6);
   CL3=yesterday_close-(((yesterday_high-yesterday_low)* 1.1)/4);
   CL4=yesterday_close-(((yesterday_high-yesterday_low) * 1.1)/2);
     if (Q > 5)
     {
      nQ=Q;
      }
       else
      {
      nQ=Q*10000;
     }
     if (D > 5)
     {
      nD=D;
      }
       else
      {
      nD=D*10000;
     }
   Comment("High= ",yesterday_high,"    Previous Days Range= ",nQ,"\nLow= ",yesterday_low,"    Current Days Range= ",nD,"\nClose= ",yesterday_close);
   //Comment("High= ",yesterday_high,"    Previous Days Range= ",nQ,"\nLow= ",yesterday_low,"\nClose= ",yesterday_close);
   //Comment("High= "+yesterday_high+"    Low= "+yesterday_low+"    Open= "+today_open);
//---- Set line labels on chart window
//----- Camarilla Lines
     if (camarilla==true)
     {
        if(ObjectFind("CH4label")!=0)
        {
         ObjectCreate("CH4label", OBJ_TEXT, 0, Time[20], CH4);
         ObjectSetText("CH4label", " H4", 8, "Arial", EMPTY);
         }
          else
         {
         ObjectMove("CH4label", 0, Time[20], CH4);
        }
        if(ObjectFind("CH3 label")!=0)
        {
         ObjectCreate("CH3 label", OBJ_TEXT, 0, Time[20], CH3);
         ObjectSetText("CH3 label", " H3", 8, "Arial", DarkGray);
         }
          else
         {
         ObjectMove("CH3 label", 0, Time[20], CH3);
        }
        if(ObjectFind("CH2 label")!=0){
         ObjectCreate("CH2 label", OBJ_TEXT, 0, Time[20], CH2);
         ObjectSetText("CH2 label", " H2", 8, "Arial", DarkGray);
         }
          else
         {
         ObjectMove("CH2 label", 0, Time[20], CH2);
        }
        if(ObjectFind("CH1 label")!=0)
        {
         ObjectCreate("CH1 label", OBJ_TEXT, 0, Time[20], CH1);
         ObjectSetText("CH1 label", " H1", 8, "Arial", DarkGray);
         }
          else
         {
         ObjectMove("CH1 label", 0, Time[20], CH1);
        }
        if(ObjectFind("CL1 label")!=0)
        {
         ObjectCreate("CL1 label", OBJ_TEXT, 0, Time[20], CL1);
         ObjectSetText("CL1 label", " L1", 8, "Arial", DarkGray);
         }
          else
         {
         ObjectMove("CL1 label", 0, Time[20], CL1);
        }
        if(ObjectFind("CL2 label")!=0)
        {
         ObjectCreate("CL2 label", OBJ_TEXT, 0, Time[20], CL2);
         ObjectSetText("CL2 label", " L2", 8, "Arial", DarkGray);
         }
          else
         {
         ObjectMove("CL2 label", 0, Time[20], CL2);
        }
        if(ObjectFind("L3 label")!=0)
        {
         ObjectCreate("L3 label", OBJ_TEXT, 0, Time[20], CL3);
         ObjectSetText("L3 label", " L3", 8, "Arial", DarkGray);
         }
          else
         {
         ObjectMove("L3 label", 0, Time[20], CL3);
        }
        if(ObjectFind("L4 label")!=0)
        {
         ObjectCreate("L4 label", OBJ_TEXT, 0, Time[20], CL4);
         ObjectSetText("L4 label", " L4", 8, "Arial", DarkGray);
         }
          else
         {
         ObjectMove("L4 label", 0, Time[20], CL4);
        }
      //---- Draw Camarilla lines on Chart
        if(ObjectFind("CH4 line")!=0)
        {
         ObjectCreate("CH4 line", OBJ_HLINE, 0, Time[40], CH4);
         ObjectSet("CH4 line", OBJPROP_STYLE, STYLE_DASHDOTDOT);
         ObjectSet("CH4 line", OBJPROP_COLOR, Navy);
         }
          else
         {
         ObjectMove("CH4 line", 0, Time[40], CH4);
        }
        if(ObjectFind("CH3 line")!=0)
        {
         ObjectCreate("CH3 line", OBJ_HLINE, 0, Time[40], CH3);
         ObjectSet("CH3 line", OBJPROP_STYLE, STYLE_DASHDOTDOT);
         ObjectSet("CH3 line", OBJPROP_COLOR, Navy);
         }
          else
         {
         ObjectMove("CH3 line", 0, Time[40], CH3);
        }
        if(ObjectFind("CH2 line")!=0)
        {
         ObjectCreate("CH2 line", OBJ_HLINE, 0, Time[40], CH2);
         ObjectSet("CH2 line", OBJPROP_STYLE, STYLE_DASHDOTDOT);
         ObjectSet("CH2 line", OBJPROP_COLOR, FireBrick);
         }
          else
         {
         ObjectMove("CH2 line", 0, Time[40], CH2);
        }
        if(ObjectFind("CH1 line")!=0)
        {
         ObjectCreate("CH1 line", OBJ_HLINE, 0, Time[40], CH1);
         ObjectSet("CH1 line", OBJPROP_STYLE, STYLE_DASHDOTDOT);
         ObjectSet("CH1 line", OBJPROP_COLOR, FireBrick);
         }
          else
         {
         ObjectMove("CH1 line", 0, Time[40], CH1);
        }
        if(ObjectFind("CL1 line")!=0)
        {
         ObjectCreate("CL1 line", OBJ_HLINE, 0, Time[40], CL1);
         ObjectSet("CL1 line", OBJPROP_STYLE, STYLE_DASHDOTDOT);
         ObjectSet("CL1 line", OBJPROP_COLOR, FireBrick);
         }
          else
         {
         ObjectMove("CL1 line", 0, Time[40], CL1);
        }
        if(ObjectFind("CL2 line")!=0)
        {
         ObjectCreate("CL2 line", OBJ_HLINE, 0, Time[40], CL2);
         ObjectSet("CL2 line", OBJPROP_STYLE, STYLE_DASHDOTDOT);
         ObjectSet("CL2 line", OBJPROP_COLOR, FireBrick);
         }
          else
         {
         ObjectMove("CL3 line", 0, Time[40], CL2);
        }
        if(ObjectFind("CL3 line")!=0)
        {
         ObjectCreate("CL3 line", OBJ_HLINE, 0, Time[40], CL3);
         ObjectSet("CL3 line", OBJPROP_STYLE, STYLE_DASHDOTDOT);
         ObjectSet("CL3 line", OBJPROP_COLOR, Navy);
         }
          else
         {
         ObjectMove("CL3 line", 0, Time[40], CL3);
        }
        if(ObjectFind("CL4 line")!=0)
        {
         ObjectCreate("CL4 line", OBJ_HLINE, 0, Time[40], CL4);
         ObjectSet("CL4 line", OBJPROP_STYLE, STYLE_DASHDOTDOT);
         ObjectSet("CL4 line", OBJPROP_COLOR, Navy);
         }
          else
         {
         ObjectMove("CL4 line", 0, Time[40], CL4);
        }
     }
//-------End of Draw Camarilla Lines
//---- End Of Program
   return(0);
  }
//+------------------------------------------------------------------+
Comments