ADX_WildersDMI_v1m
Download script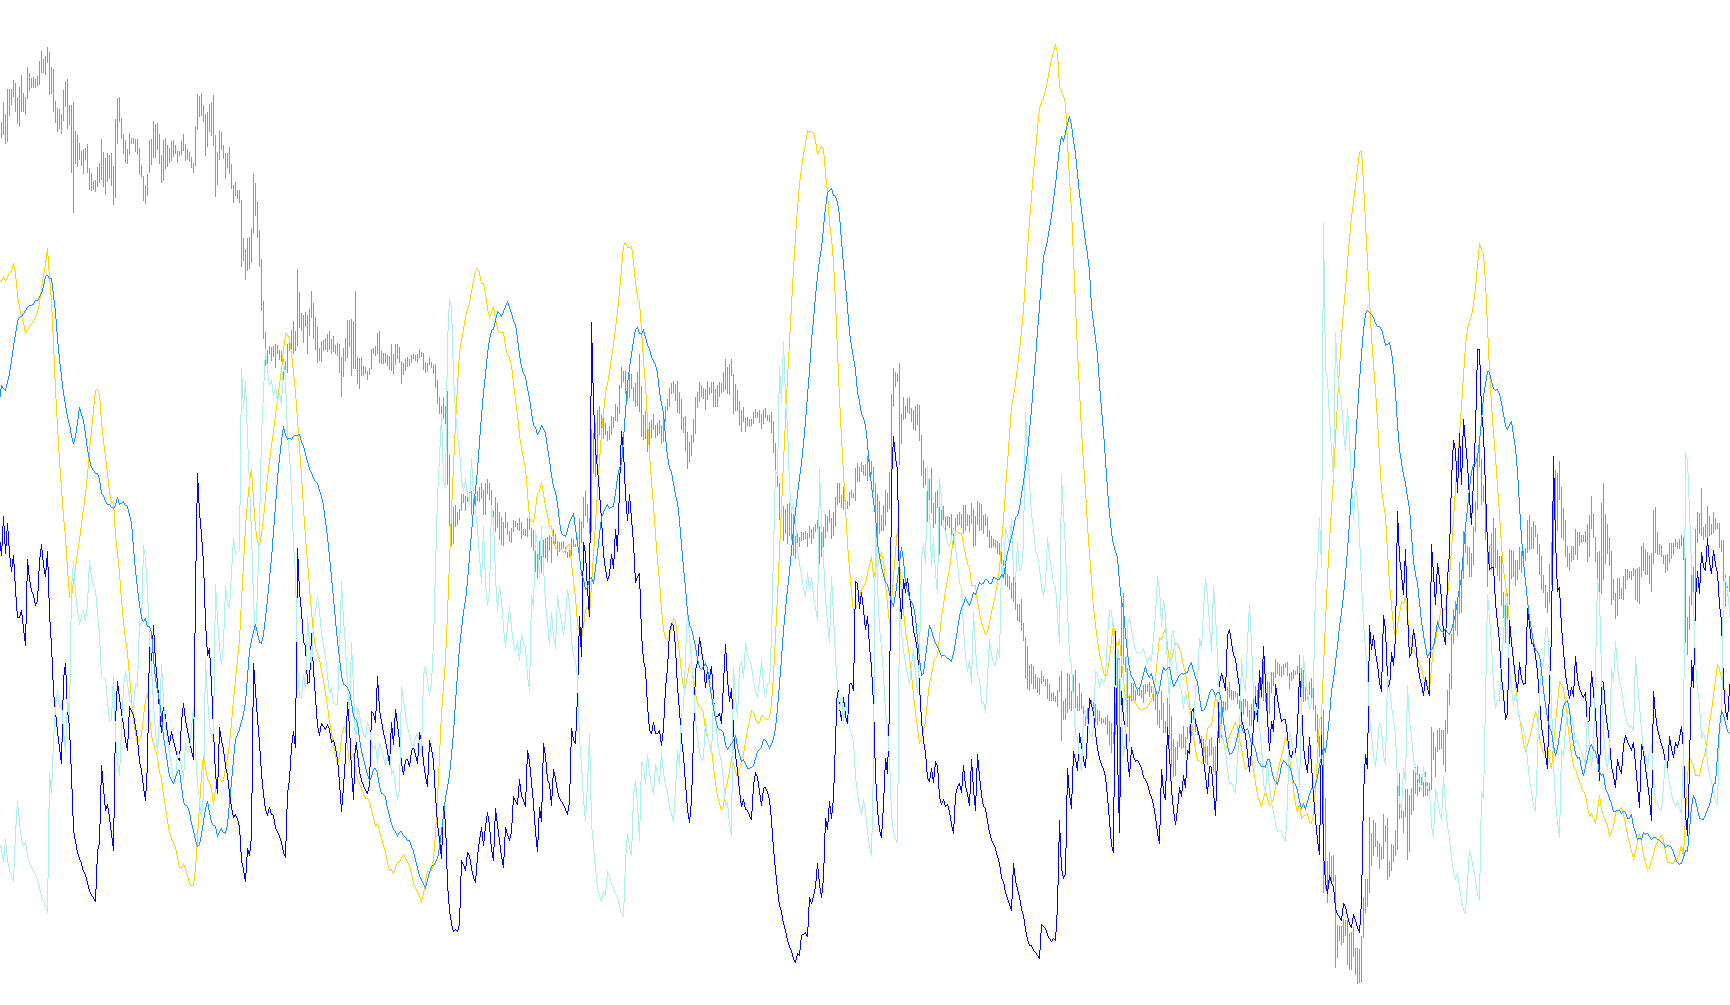
This tool is designed to analyze market trends and momentum by evaluating the relationship between buying and selling pressures. It provides a multi-layered view of price action, helping traders distinguish between strong trending markets and periods of consolidation or noise.
Core Logic and Methodology
The script functions by processing historical price data (highs, lows, and closing prices) through several distinct stages of calculation:
1. Directional Movement Identification The tool first determines the "strength" of upward movement (Bulls) versus downward movement (Bears). Rather than looking at raw price changes, it calculates these values based on smoothed averages of historical highs and lows. By comparing these two forces, the logic identifies which direction currently holds the most momentum.
2. Smoothing and Filtering To prevent "market noise" from creating false signals, the script applies a smoothing technique (modeled after Wilder's approach). This ensures that the resulting indicators are not overly reactive to tiny, insignificant price flickers, but instead reflect the underlying trend of the market over a set period.
3. Relative Strength Tracking The tool calculates a "True Range" to understand the total volatility of the market. It then uses this range to normalize the bullish and bearish movements into two primary indicators:
- Positive Directional Index (+DI): Represents the strength of the upward trend.
- Negative Directional Index (-DI): Represents the strength of the downward trend.
4. Trend Strength and Confirmation (ADX & ADXR) Beyond just showing direction, the script calculates the overall intensity of the trend:
- DX/ADX: This measures how much of a "trend" actually exists. It compares the distance between the +DI and -DI lines to determine if the market is moving aggressively in one direction or drifting sideways.
- ADXR: This is a secondary smoothing of the ADX, designed to provide an even more stable view of trend persistence, making it easier to see if a trend is gaining strength or beginning to fade.
Summary for the User
In practical terms, this script helps you visualize three things simultaneously:
- The Direction: Are the "Bulls" winning or are the "Bears" winning?
- The Volatility: How much price movement is actually happening relative to previous periods?
- The Trend Strength: Is the current move a strong, committed trend that is likely to continue, or is it a weak movement that might soon stall?
//+------------------------------------------------------------------+
//|                                                WildersDMI_v1.mq4 |
//|                           Copyright © 2007, TrendLaboratory Ltd. |
//|            http://finance.groups.yahoo.com/group/TrendLaboratory |
//|                                       E-mail: igorad2004@list.ru |
//+------------------------------------------------------------------+
#property copyright "Copyright © 2007, TrendLaboratory Ltd."
#property link      "http://finance.groups.yahoo.com/group/TrendLaboratory"

#property indicator_separate_window
#property indicator_buffers   4
#property indicator_color1    LightBlue
#property indicator_width1    2
#property indicator_color2    Lime
#property indicator_width2    1
#property indicator_style2    2
#property indicator_color3    Tomato
#property indicator_width3    1
#property indicator_style3    2
#property indicator_color4    Orange
#property indicator_width4    2
#property indicator_level1    20
//---- input parameters
extern int       MA_Length    =  1; // Period of additional smoothing
extern int       DMI_Length   = 14; // Period of DMI
extern int       ADX_Length   = 14; // Period of ADX
extern int       ADXR_Length  = 14; // Period of ADXR
extern int       UseADX       =  1; // Use ADX: 0-off,1-on
extern int       UseADXR      =  1; // Use ADXR: 0-off,1-on
//---- buffers
double ADX[];
double PDI[];
double MDI[];
double ADXR[];
double sPDI[];
double sMDI[];
double STR[];
double DX[];

//+------------------------------------------------------------------+
//| Custom indicator initialization function                         |
//+------------------------------------------------------------------+
int init()
{
//---- indicators
   IndicatorBuffers(8);
   SetIndexStyle(0,DRAW_LINE);
   SetIndexBuffer(0,ADX);
   SetIndexStyle(1,DRAW_LINE);
   SetIndexBuffer(1,PDI);
   SetIndexStyle(2,DRAW_LINE);
   SetIndexBuffer(2,MDI);
   SetIndexStyle(3,DRAW_LINE);
   SetIndexBuffer(3,ADXR);
   SetIndexBuffer(4,sPDI);
   SetIndexBuffer(5,sMDI);
   SetIndexBuffer(6,STR);
   SetIndexBuffer(7,DX);
   //---- name for DataWindow and indicator subwindow label
   string short_name="WildersDMI("+MA_Length+","+DMI_Length+","+ADX_Length+","+ADXR_Length+")";
   IndicatorShortName(short_name);
   SetIndexLabel(0,"ADX");
   SetIndexLabel(1,"+DI");
   SetIndexLabel(2,"-DI");
   SetIndexLabel(3,"ADXR");
//----
   SetIndexDrawBegin(0,DMI_Length+MA_Length);
   SetIndexDrawBegin(1,DMI_Length+MA_Length);
   SetIndexDrawBegin(2,DMI_Length+MA_Length);
   SetIndexDrawBegin(3,DMI_Length+MA_Length);
   //--
      SetIndexShift(3,2);

   return(0);
}

//+------------------------------------------------------------------+
//| Custom indicator iteration function                              |
//+------------------------------------------------------------------+
int start()
  {
   int      shift, limit, counted_bars=IndicatorCounted();
   double alfa1 = 1.0/DMI_Length;
   double alfa2 = 1.0/ADX_Length;
//----
   if (counted_bars < 0) return(-1);

   if(counted_bars<1)
      for(shift=1;shift<=MA_Length+DMI_Length;shift++)
      {PDI[Bars-shift]=0.0;MDI[Bars-shift]=0.0;ADX[Bars-shift]=0.0;
      sPDI[Bars-shift]=0.0;sMDI[Bars-shift]=0.0;DX[Bars-shift]=0.0;
      STR[Bars-shift]=0.0;ADXR[Bars-shift]=0.0;}

   shift=Bars-MA_Length-DMI_Length-1;
   if(counted_bars>=DMI_Length+MA_Length) shift=Bars-counted_bars-1;

   while(shift>=0)
   {
   double AvgHigh  = iMA(NULL,0,MA_Length,0,1,PRICE_HIGH,shift);
   double AvgHigh1 = iMA(NULL,0,MA_Length,0,1,PRICE_HIGH,shift+1);
   double AvgLow   = iMA(NULL,0,MA_Length,0,1,PRICE_LOW,shift);
   double AvgLow1  = iMA(NULL,0,MA_Length,0,1,PRICE_LOW,shift+1);
   double AvgClose1= iMA(NULL,0,MA_Length,0,1,PRICE_CLOSE,shift+1);

   double Bulls = 0.5*(MathAbs(AvgHigh-AvgHigh1)+(AvgHigh-AvgHigh1));
   double Bears = 0.5*(MathAbs(AvgLow1-AvgLow)+(AvgLow1-AvgLow));

   if (Bulls > Bears) Bears = 0;
   else
   if (Bulls < Bears) Bulls = 0;
   else
   if (Bulls == Bears) {Bulls = 0;Bears = 0;}

   sPDI[shift] = sPDI[shift+1] + alfa1 * (Bulls - sPDI[shift+1]);
   sMDI[shift] = sMDI[shift+1] + alfa1 * (Bears - sMDI[shift+1]);

   double   TR = MathMax(AvgHigh-AvgLow,AvgHigh-AvgClose1);
   STR[shift]  = STR[shift+1] + alfa1 * (TR - STR[shift+1]);

      if(STR[shift]>0 )
      {
      PDI[shift] = 100*sPDI[shift]/STR[shift];
      MDI[shift] = 100*sMDI[shift]/STR[shift];
      }

      if( UseADX > 0)
      {
      if((PDI[shift] + MDI[shift])>0)
      DX[shift] = 100*MathAbs(PDI[shift] - MDI[shift])/(PDI[shift] + MDI[shift]);
      else DX[shift] = 0;

      ADX[shift] = ADX[shift+1] + alfa2 * ( DX[shift] - ADX[shift+1]);

      if(UseADXR >0) ADXR[shift] = 0.5*(ADX[shift] + ADX[shift+ADXR_Length]);
      }
   shift--;
   }

//----
   return(0);
  }
//+------------------------------------------------------------------+
Comments