Zigzag2_R_
Download script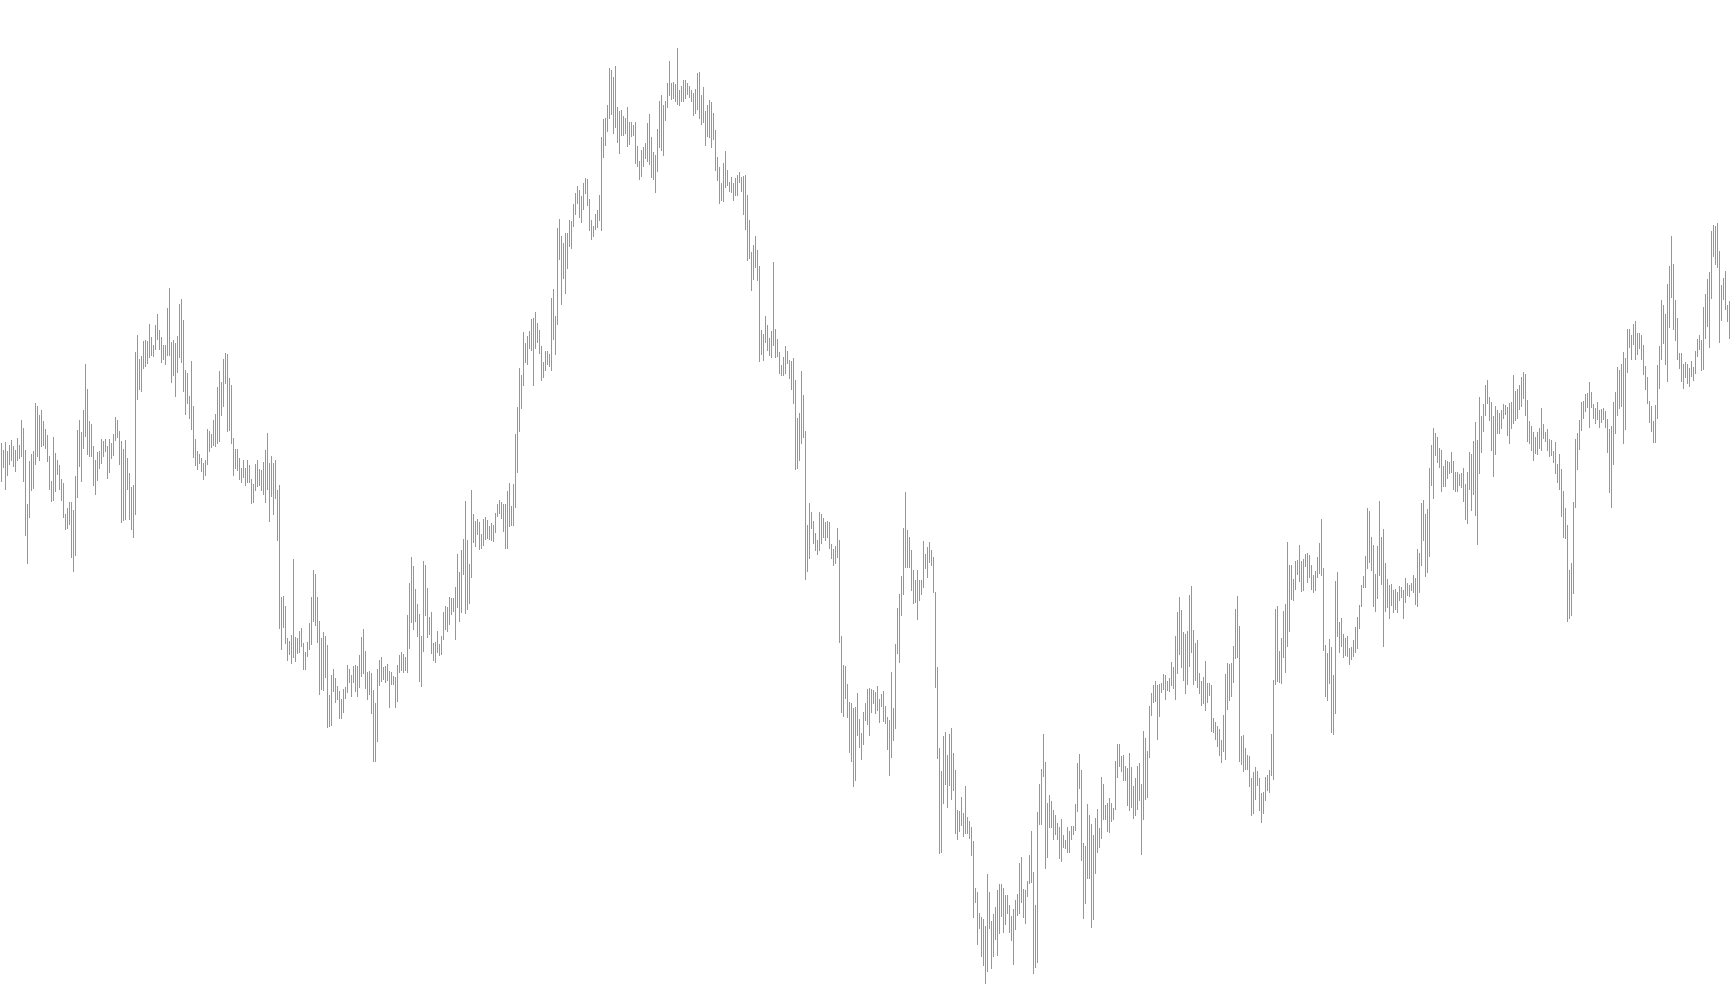
This script is designed to create a "ZigZag" visual on a trading chart, which is a common tool used to identify the significant trends and structural pivots (the high and low points) of price movement. Unlike standard indicators that might clutter the screen with constant data, this logic filters out minor price fluctuations to highlight the core direction of the market.
Core Logic Overview
The script works by systematically scanning historical price data to find "peaks" (highs) and "valleys" (lows). To ensure these points are significant, it uses three main filtering layers:
1. Depth and Deviation Filtering The tool looks at a specific window of recent bars (Depth) to identify local highs and lows. It then applies a "Deviation" rule—meaning a new point is only registered if the price move is large enough to be considered meaningful. This prevents the chart from being filled with tiny, insignificant wiggles in the price.
2. The Backstep Verification To ensure that a peak or valley is truly a turning point and not just a momentary pause, the script uses a "Backstep" logic. It looks backward at the bars immediately preceding a point to confirm that the current point is indeed the most extreme high or low in that specific neighborhood.
3. Peak and Valley Tracking The script maintains an internal memory of what it last found:
- If it just identified a High (Peak), its primary logic shifts to look for the next Low (Valley).
- If it just identified a Low (Valley), it focuses on finding the next High (Peak).
This "alternating" behavior ensures that the ZigZag line connects logically from one major trend point to the next, rather than jumping between multiple highs or lows in a row.
Handling "Outside Bars"
A unique feature of this specific script is how it handles "Outside Bars"—bars where the price moved so significantly that both the High and the Low are outside the range of the previous bar. The logic is programmed to recognize these complex movements and ensure they are correctly mapped into the peaks and valleys without breaking the continuity of the trend line.
Summary of Visual Behavior
- Red and Blue Lines: These represent the two distinct data paths for highs and lows, allowing the script to draw continuous segments between major price pivots.
- Dynamic Updates: As new price data arrives, the script constantly recalculates the most recent points. If a newer price exceeds a previously identified peak/valley within the allowed parameters, it "updates" that point to ensure the visual stays accurate to the current market reality.
//+------------------------------------------------------------------+
//|                                                   Zigzag2_R_.mq4 |
//|                 Copyright © 2005-2007, MetaQuotes Software Corp. |
//|                                       http://www.metaquotes.net/ |
//+------------------------------------------------------------------+
/* Â ñòàíäàðòíîì èíäèêàòîðå http://codebase.mql4.com/ru/238 äëÿ      |
ðèñîâàíèÿ èñïîëüçîâàëñÿ ñòèëü DRAW_SECTION. Ýòîò ñòèëü ïîçâîëÿåò     |
ðèñîâàòü îòðåçêàìè òîëüêî ìåæäó òî÷êàìè, íàõîäÿùèìèìñÿ íà ðàçíûõ     |
áàðàõ. Ñòèëü îòðèñîâêè DRAW_ZIGZAG ïîçâîëÿåò ñíÿòü ýòî îãðàíè÷åíèå,  |
äëÿ ýòîãî èñïîëüçóþòñÿ äâà áóôåðà âìåñòî îäíîãî. Äëÿ èëëþñòðàöèè     |
ýòîãî ñòèëÿ è áûë íàïèñàí Zigzag2_R_.mq4.                            |
 êîä äîáàâëåíà îáðàáîòêà âíåøíåãî  áàðà (outside bar), êîãäà  High  |
òåêóùåãî áàðà âûøå ïðåäûäóùèõ, à Low òåêóùåãî áàðà íèæå ïðåäûäóùèõ.  |
Êîä òàêæå äåìîíñòðèðóåò, ÷òî öâåò îïðåäåëÿåòñÿ öâåòîì ïåðâîãî èç     |
äâóõ áóôåðîâ.                                                        |
#property indicator_chart_window                                     |
#property indicator_buffers 2                                        |
#property indicator_color1 Blue                                      |
#property indicator_color2 Red                                       |
Äëÿ âûçîâà ýòîãî èíäèêàòîðà èç äðóãèõ ïðîãðàìì íà mql4 òåïåðü        |
íåîáõîäèìî èñïîëüçîâàòü äâå êîíñòðóêöèè:                             |
iCustom(NULL, 0, "Zigzag2_R_", 12, 5, 3, 0, index) - ïè÷êè           |
iCustom(NULL, 0, "Zigzag2_R_", 12, 5, 3, 1, index) - äîíûøêè         |
Áëîê îáðàáîòêè âíåøíåãî áàðà äàí êàê ïðèìåð. Âû ìîæåòå èñïîëüçîâàòü  |
ñâîé àëãîðèòì äëÿ òàêîé ñèòóàöèè.                                    |
//+------------------------------------------------------------------+
*/
#property copyright "Copyright © 2007, MetaQuotes Software Corp."
#property link      "http://www.metaquotes.net/"
//----
#property indicator_chart_window
#property indicator_buffers 2
#property indicator_color1 Blue
#property indicator_color2 Red
//---- indicator parameters
extern int ExtDepth = 12;
extern int ExtDeviation = 5;
extern int ExtBackstep = 3;
//---- indicator buffers
double ZigzagPeakBuffer[];
double ZigzagLawnBuffer[];
double HighMapBuffer[];
double LowMapBuffer[];
int level = 3; // recounting's depth
bool downloadhistory = false;
//+------------------------------------------------------------------+
//| Custom indicator initialization function                         |
//+------------------------------------------------------------------+
int init()
  {
   IndicatorBuffers(4);
//---- drawing settings
   SetIndexStyle(0, DRAW_ZIGZAG);
   SetIndexStyle(1, DRAW_ZIGZAG);
//---- indicator buffers mapping
   SetIndexBuffer(0, ZigzagPeakBuffer);
   SetIndexBuffer(1, ZigzagLawnBuffer);
   SetIndexLabel(0, "ZigzafPeak");
   SetIndexLabel(1, "ZigzafLawn");
//----
   SetIndexBuffer(2, HighMapBuffer);
   SetIndexBuffer(3, LowMapBuffer);
//----
   SetIndexEmptyValue(0, 0.0);
   SetIndexEmptyValue(1, 0.0);
//---- indicator short name
   IndicatorShortName("ZigZag(" + ExtDepth + "," + ExtDeviation + "," +
                      ExtBackstep + ")");
//---- initialization done
   return(0);
  }
//+------------------------------------------------------------------+
//|                                                                  |
//+------------------------------------------------------------------+
int start()
  {
   int i, counted_bars = IndicatorCounted();
   int limit, counterZ, whatlookfor;
   int shift, back, lasthighpos, lastlowpos;
   double val, res;
   double curlow, curhigh, lasthigh, lastlow;
// history was downloaded
   if(counted_bars == 0 && downloadhistory)
     {
       ArrayInitialize(ZigzagPeakBuffer, 0.0);
       ArrayInitialize(ZigzagLawnBuffer, 0.0);
       ArrayInitialize(HighMapBuffer, 0.0);
       ArrayInitialize(LowMapBuffer, 0.0);
     }
//----
   if(counted_bars == 0)
     {
       limit = Bars - ExtDepth;
       downloadhistory = true;
     }
//----
   if(counted_bars > 0)
     {
       //----
       while(counterZ < level && i < 100)
         {
           res = (ZigzagPeakBuffer[i] + ZigzagLawnBuffer[i]);
           //----
           if(res != 0)
               counterZ++;
           i++;
         }
       i--;
       limit = i;
       //----
       if(LowMapBuffer[i] != 0)
         {
           curlow = LowMapBuffer[i];
           whatlookfor = 1;
         }
       else
         {
           curhigh = HighMapBuffer[i];
           whatlookfor = -1;
         }
       //----
       for(i = limit - 1; i >= 0; i--)
         {
           ZigzagPeakBuffer[i] = 0.0;
           ZigzagLawnBuffer[i] = 0.0;
           LowMapBuffer[i] = 0.0;
           HighMapBuffer[i] = 0.0;
         }
     }
//----
   for(shift = limit; shift >= 0; shift--)
     {
       val = Low[iLowest(NULL, 0, MODE_LOW, ExtDepth, shift)];
       //----
       if(val == lastlow)
           val = 0.0;
       else
         {
           lastlow = val;
           //----
           if((Low[shift] - val) > (ExtDeviation*Point))
               val = 0.0;
           else
             {
               //----
               for(back = 1; back <= ExtBackstep; back++)
                 {
                   res = LowMapBuffer[shift+back];
                   //----
                   if((res != 0) && (res > val))
                       LowMapBuffer[shift+back] = 0.0;
                 }
             }
         }
       //----
       if(Low[shift] == val)
           LowMapBuffer[shift] = val;
       else
           LowMapBuffer[shift] = 0.0;
       //--- high
       val = High[iHighest(NULL, 0, MODE_HIGH, ExtDepth, shift)];
       //----
       if(val == lasthigh)
           val = 0.0;
       else
         {
           lasthigh = val;
           //----
           if((val - High[shift]) > (ExtDeviation*Point))
               val = 0.0;
           else
             {
               //----
               for(back = 1; back <= ExtBackstep; back++)
                 {
                   res = HighMapBuffer[shift+back];
                   //----
                   if((res != 0) && (res < val))
                       HighMapBuffer[shift+back] = 0.0;
                 }
             }
         }
       //----
       if(High[shift] == val)
           HighMapBuffer[shift] = val;
       else
           HighMapBuffer[shift] = 0.0;
     }
// final cutting
   if(whatlookfor == 0)
     {
       lastlow = 0;
       lasthigh = 0;
     }
   else
     {
       lastlow = curlow;
       lasthigh = curhigh;
     }
//----
   for(shift = limit; shift >= 0; shift--)
     {
       res = 0.0;
       switch(whatlookfor)
         {
           // look for peak or lawn
           case 0: if(lastlow == 0 && lasthigh == 0)
                     {
                       if(HighMapBuffer[shift] != 0)
                         {
                           lasthigh = High[shift];
                           lasthighpos = shift;
                           whatlookfor = -1;
                           ZigzagPeakBuffer[shift] = lasthigh;
                           res = 1;
                         }
                       if(LowMapBuffer[shift] != 0)
                         {
                           lastlow = Low[shift];
                           lastlowpos = shift;
                           whatlookfor = 1;
                           ZigzagLawnBuffer[shift] = lastlow;
                           res = 1;
                         }
                     }
                   break;
           // look for peak
           case 1: if(LowMapBuffer[shift] != 0.0 && LowMapBuffer[shift] < lastlow &&
                      HighMapBuffer[shift] == 0.0)
                     {
                       ZigzagLawnBuffer[lastlowpos] = 0.0;
                       lastlowpos = shift;
                       lastlow = LowMapBuffer[shift];
                       ZigzagLawnBuffer[shift] = lastlow;
                       res = 1;
                     }
                   if(HighMapBuffer[shift] != 0.0 && LowMapBuffer[shift] == 0.0)
                     {
                       lasthigh = HighMapBuffer[shift];
                       lasthighpos = shift;
                       ZigzagPeakBuffer[shift] = lasthigh;
                       whatlookfor = -1;
                       res = 1;
                     }
                   break;
           // look for lawn
           case -1:  if(HighMapBuffer[shift] != 0.0 &&
                        HighMapBuffer[shift] > lasthigh &&
                        LowMapBuffer[shift] == 0.0)
                       {
                         ZigzagPeakBuffer[lasthighpos] = 0.0;
                         lasthighpos = shift;
                         lasthigh = HighMapBuffer[shift];
                         ZigzagPeakBuffer[shift] = lasthigh;
                       }
                     if(LowMapBuffer[shift] != 0.0 && HighMapBuffer[shift] == 0.0)
                       {
                         lastlow = LowMapBuffer[shift];
                         lastlowpos = shift;
                         ZigzagLawnBuffer[shift] = lastlow;
                         whatlookfor = 1;
                       }
                     break;
           default: return;
         }
     }
//----
   return(0);
  }
//+------------------------------------------------------------------+
Comments