maf_2
Download script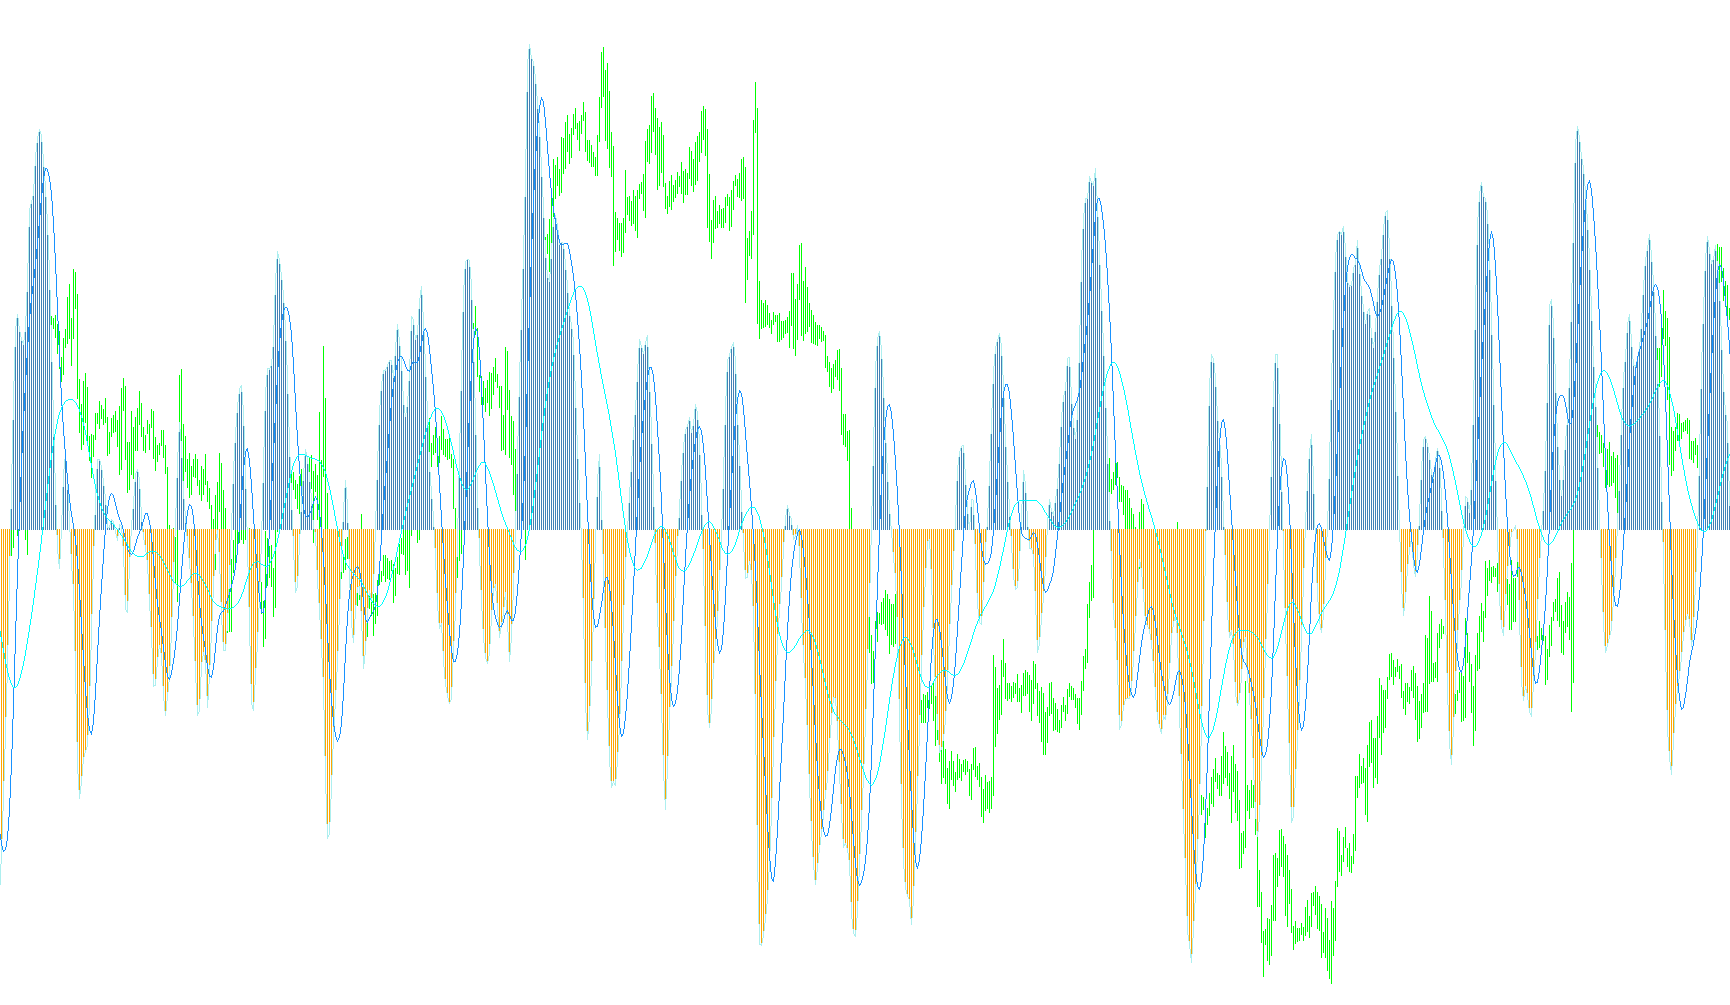
This script is a specialized technical analysis tool designed for MetaTrader to help traders identify momentum shifts and potential entry or exit points in the financial markets. Rather than just looking at price alone, it processes market data through a series of mathematical layers to smooth out noise and highlight underlying trends.
Core Logic Overview
The indicator operates by analyzing the relationship between current prices and recent high/low extremes over a specific timeframe. Here is a breakdown of how it processes this information:
1. Price Selection and Range Analysis The tool first determines a representative price for each candle (such as the Open, Close, High, Low, or a variety of averages). It then identifies the highest high and lowest low within a user-defined period. By comparing where the current price sits relative to this range, the script calculates the "strength" of the current move.
2. Momentum Calculation and Smoothing The script converts these price positions into a momentum value. To ensure that the data doesn't jump erratically from one candle to the next, it applies a smoothing coefficient. This creates a more fluid representation of market sentiment, allowing traders to see whether the market is accelerating or decelerating.
3. Logarithmic Transformation A key feature of this logic is its use of logarithmic calculations to scale the momentum values. This helps in normalizing the data, making it easier to visualize extreme movements while still maintaining the integrity of smaller, subtle price shifts.
4. Signal Generation (Buy, Sell, and Exit) The indicator looks for specific "crossovers" and thresholds to trigger visual cues on your chart:
- Sell/Entry Signals: The script monitors the relationship between the current momentum value and its previous values. When the momentum reaches a specific threshold and reverses direction relative to its recent history, it identifies a potential signal. These are displayed as text labels on the chart (e.g., "Open Sell Trade").
- Exit Signals: The tool also tracks when momentum loses its strength or changes polarity in a way that suggests a trend is exhausted. It can automatically mark these points as "Exit Trade" labels to help traders decide when to take profits or cut losses.
5. Moving Average Overlay To provide even more context, the script calculates two additional layers of moving averages based on the momentum data itself (rather than just the raw price). These lines act as a secondary filter:
- The fast moving average reacts quickly to recent momentum changes.
- The slow moving average tracks the broader trend of the momentum.
By observing where these averages sit and how the histogram values interact with them, a trader can better distinguish between a temporary price spike and a sustained shift in market direction.
#property indicator_separate_window
#property indicator_buffers 5
#property indicator_color1 SteelBlue
#property indicator_color2 Orange
#property indicator_color3 Black
#property indicator_color4 Blue
#property indicator_color5 Red

double g_ibuf_76[];
double g_ibuf_80[];
double g_ibuf_84[];
double g_ibuf_88[];
double g_ibuf_92[];
extern int period = 10;
extern int price = 0;
extern bool Mode_Fast = FALSE;
extern bool Signals = FALSE;
extern int MA1period = 9;
extern int MA2period = 45;
extern string TypeHelp = "SMA- 0, EMA - 1, SMMA - 2, LWMA- 3";
extern string TypeHelp2 = "TypeMA1=0, TypeMA2=3";
extern int TypeMA1 = 0;
extern int TypeMA2 = 3;
double gd_144 = 0.0;
double gd_152 = 0.0;
double gd_unused_160 = 0.0;
double gd_168 = 0.0;
double gd_176 = 0.0;
double gd_184 = 0.0;
int gi_unused_192 = 0;
int gi_unused_196 = 0;

int init() {
   SetIndexStyle(0, DRAW_HISTOGRAM, STYLE_SOLID, 1, SteelBlue);
   SetIndexBuffer(0, g_ibuf_76);
   SetIndexStyle(1, DRAW_HISTOGRAM, STYLE_SOLID, 1, Orange);
   SetIndexBuffer(1, g_ibuf_80);
   SetIndexStyle(2, DRAW_LINE);
   SetIndexLabel(2, "line");
   SetIndexBuffer(2, g_ibuf_84);
   SetIndexStyle(3, DRAW_LINE);
   SetIndexLabel(3, "MA1 " + MA1period);
   SetIndexStyle(4, DRAW_LINE);
   SetIndexLabel(4, "MA2 " + MA2period);
   SetIndexBuffer(3, g_ibuf_88);
   SetIndexBuffer(4, g_ibuf_92);
   return (0);
}

int deinit() {
   for (int l_count_0 = 0; l_count_0 < Bars; l_count_0++) {
      ObjectDelete("Sell Signal: " + DoubleToStr(l_count_0, 0));
      ObjectDelete("Buy Signal: " + DoubleToStr(l_count_0, 0));
      ObjectDelete("Exit: " + DoubleToStr(l_count_0, 0));
   }
   return (0);
}

int start() {
   double l_price_12;
   double ld_unused_20;
   int li_0 = IndicatorCounted();
   double ld_28 = 0;
   double ld_36 = 0;
   double ld_44 = 1.2;
   if (li_0 > 0) li_0--;
   int li_8 = Bars - li_0;
   if (Mode_Fast) li_8 = 100;
   for (int li_4 = 0; li_4 < li_8; li_4++) {
      ld_36 = High[iHighest(NULL, 0, MODE_HIGH, period, li_4)];
      ld_28 = Low[iLowest(NULL, 0, MODE_LOW, period, li_4)];
      switch (price) {
      case 1:
         l_price_12 = Open[li_4];
         break;
      case 2:
         l_price_12 = Close[li_4];
         break;
      case 3:
         l_price_12 = High[li_4];
         break;
      case 4:
         l_price_12 = Low[li_4];
         break;
      case 5:
         l_price_12 = (High[li_4] + Low[li_4] + Close[li_4]) / 3.0;
         break;
      case 6:
         l_price_12 = (Open[li_4] + High[li_4] + Low[li_4] + Close[li_4]) / 4.0;
         break;
      case 7:
         l_price_12 = (Open[li_4] + Close[li_4]) / 2.0;
         break;
      default:
         l_price_12 = (High[li_4] + Low[li_4]) / 2.0;
      }
      gd_144 = 0.66 * ((l_price_12 - ld_28) / (ld_36 - ld_28) - 0.5) + 0.67 * gd_152;
      gd_144 = MathMin(MathMax(gd_144, -0.999), 0.999);
      gd_168 = MathLog((gd_144 + 1.0) / (1 - gd_144)) / 2.0 + gd_176 / 2.0;
      g_ibuf_76[li_4] = 0;
      g_ibuf_80[li_4] = 0;
      if (gd_168 < 0.0 && gd_176 > 0.0) {
         if (Signals) {
            ObjectCreate("Exit Trade: " + DoubleToStr(li_4, 0), OBJ_TEXT, 0, Time[li_4], l_price_12);
            ObjectSetText("Exit Trade: " + DoubleToStr(li_4, 0), "Exit Trade At " + DoubleToStr(l_price_12, 4), 7, "Arial", White);
         }
         gi_unused_192 = 0;
      }
      if (gd_168 > 0.0 && gd_176 < 0.0) {
         if (Signals) {
            ObjectCreate("Exit Trade: " + DoubleToStr(li_4, 0), OBJ_TEXT, 0, Time[li_4], l_price_12);
            ObjectSetText("Exit Trade: " + DoubleToStr(li_4, 0), "Exit Trade At " + DoubleToStr(l_price_12, 4), 7, "Arial", White);
         }
         gi_unused_196 = 0;
      }
      if (gd_168 >= 0.0) {
         g_ibuf_76[li_4] = gd_168;
         g_ibuf_84[li_4] = gd_168;
      } else {
         g_ibuf_80[li_4] = gd_168;
         g_ibuf_84[li_4] = gd_168;
      }
      ld_unused_20 = li_4;
      if (gd_168 < (-ld_44) && gd_168 > gd_176 && gd_176 <= gd_184) {
         if (Signals) {
            ObjectCreate("Sell Signal: " + DoubleToStr(li_4, 0), OBJ_TEXT, 0, Time[li_4], l_price_12);
            ObjectSetText("Sell Signal: " + DoubleToStr(li_4, 0), "Open Sell Trade At " + DoubleToStr(l_price_12, 4), 7, "Arial", Red);
         }
         gi_unused_196 = 1;
      }
      if (gd_168 > ld_44 && gd_168 < gd_176 && gd_176 >= gd_184) {
         if (Signals) {
            ObjectCreate("Sell Signal: " + DoubleToStr(li_4, 0), OBJ_TEXT, 0, Time[li_4], l_price_12);
            ObjectSetText("Sell Signal: " + DoubleToStr(li_4, 0), "Open Sell Trade At " + DoubleToStr(l_price_12, 4), 7, "Arial", Lime);
         }
         gi_unused_192 = 1;
      }
      gd_152 = gd_144;
      gd_184 = gd_176;
      gd_176 = gd_168;
   }
   for (li_4 = 0; li_4 < li_8; li_4++) g_ibuf_88[li_4] = iMAOnArray(g_ibuf_84, Bars, MA1period, 0, TypeMA1, li_4);
   for (li_4 = 0; li_4 < li_8; li_4++) g_ibuf_92[li_4] = iMAOnArray(g_ibuf_88, Bars, MA2period, 0, TypeMA2, li_4);
   return (0);
}
Comments