_MACDTrad
Download script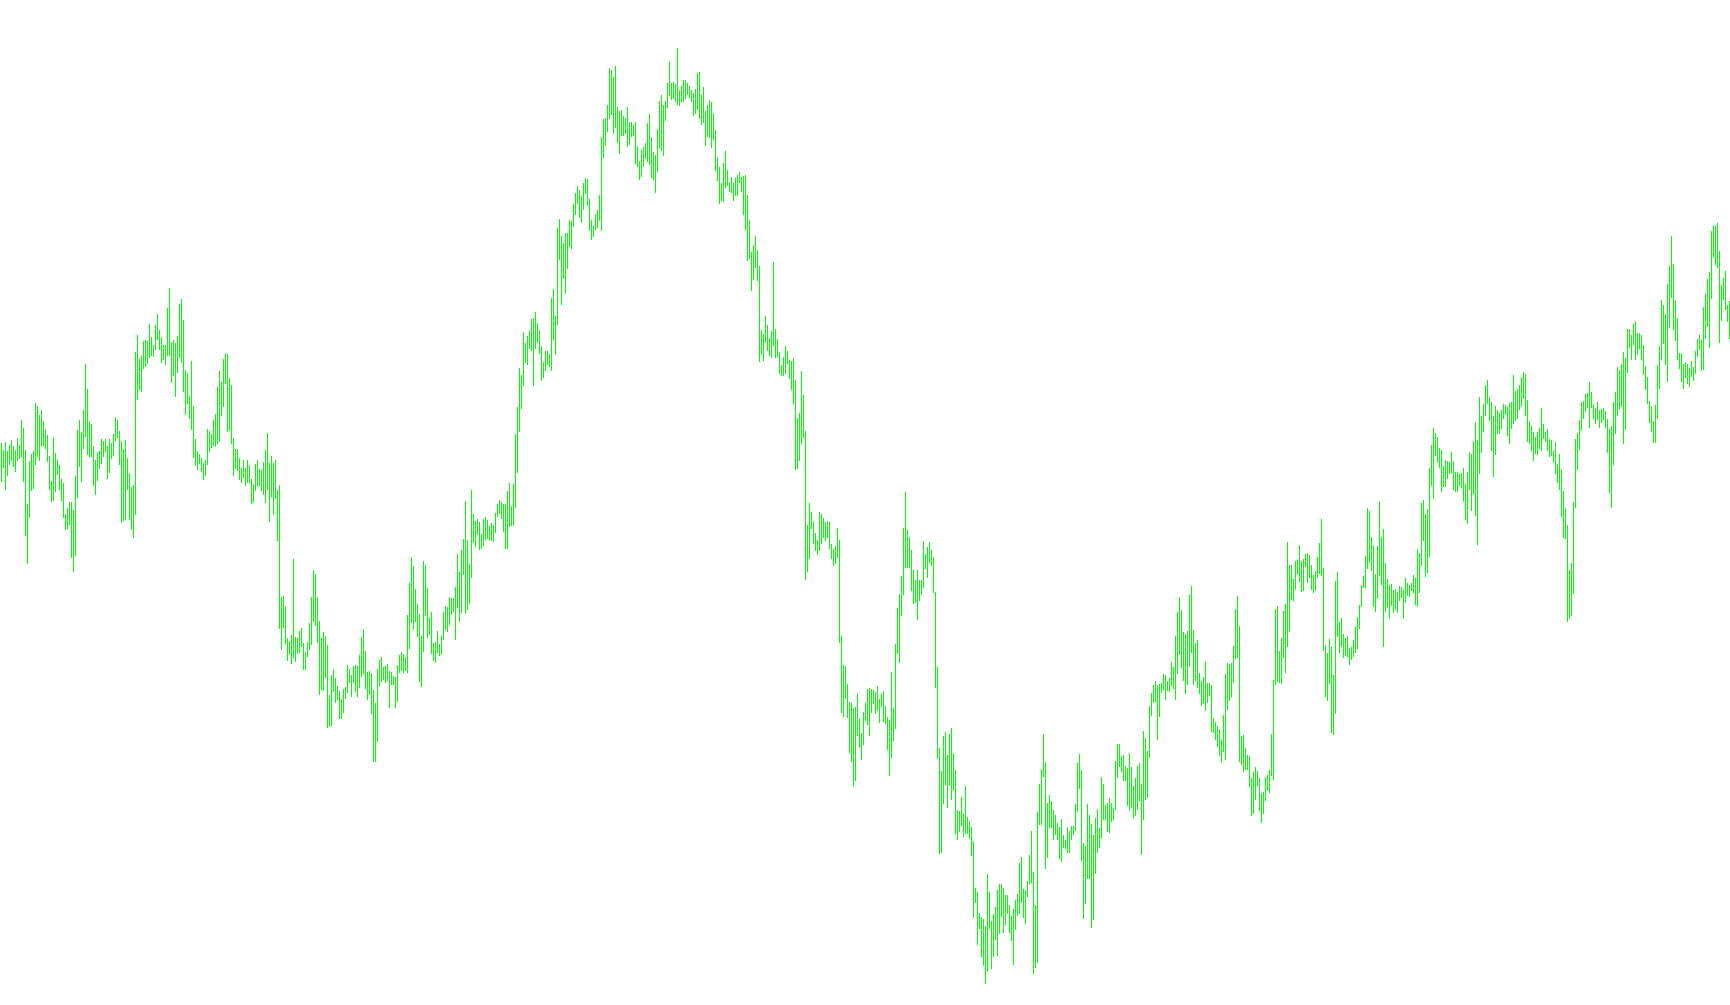
This technical indicator is designed to help traders visualize momentum and price trends by analyzing the relationship between two different moving averages. Instead of looking at price action alone, it calculates the "distance" between fast-moving price data and slower-moving data to identify potential shifts in market direction.
How the Logic Works
The tool operates using a three-step calculation process to provide a comprehensive view of market dynamics:
1. Calculating Momentum (The MACD Line) The script first tracks two different types of moving averages simultaneously: a "Fast" average (which reacts quickly to recent price changes) and a "Slow" average (which reflects the broader, long-term trend). By subtracting the slow average from the fast average, the tool creates a primary line. When this line is above zero, it suggests that short-term momentum is stronger than the long-term trend; when it falls below zero, it suggests the opposite.
2. Smoothing the Data (The Signal Line) To make the data easier to read and reduce "noise," the script takes the primary momentum line calculated in the first step and applies a secondary smoothing process to it. This creates a "Signal Line." This line acts as a baseline; traders often look for moments where the primary momentum line crosses over this signal line as a potential cue that a trend might be changing direction.
3. Visualizing the Gap (The Histogram) Finally, the tool calculates the difference between the primary momentum line and the signal line to produce a visual histogram. The height and direction of these bars represent the strength of the current move.
- Large bars indicate strong, accelerating momentum.
- Shrinking bars suggest that the current trend is losing steam.
- Crossing the zero point on the histogram often highlights where the momentum has shifted from bullish to bearish, or vice versa.
Summary for the User
In plain terms, this script filters out the daily "jitter" of the market to show you the underlying flow of price. It identifies whether the market is accelerating, slowing down, or reversing by measuring the gap between immediate price action and historical averages. The result is a visual dashboard that helps you see not just where the price is going, but how much strength is behind that move.
//---- indicator settings
#property  indicator_separate_window
#property  indicator_buffers 3
#property  indicator_color1  Silver
#property  indicator_color2  Red
#property  indicator_color3  Blue
#property  indicator_width1  2
//---- indicator parameters
extern int FastEMA=89;
extern int SlowEMA=233;
extern int SignalSMA=34;
//---- indicator buffers
double     MacdBuffer[];
double     SignalBuffer[];
double     HistoBuffer[];

//+------------------------------------------------------------------+
//| Custom indicator initialization function                         |
//+------------------------------------------------------------------+
int init()
  {
//---- drawing settings
   SetIndexStyle(0,DRAW_NONE);
   SetIndexStyle(1,DRAW_LINE);
   SetIndexStyle(2,DRAW_HISTOGRAM);
   SetIndexDrawBegin(1,SignalSMA);
   IndicatorDigits(Digits+1);
//---- indicator buffers mapping
   SetIndexBuffer(0,MacdBuffer);
   SetIndexBuffer(1,SignalBuffer);
   SetIndexBuffer(2,HistoBuffer);
//---- name for DataWindow and indicator subwindow label
   IndicatorShortName("MACD("+FastEMA+","+SlowEMA+","+SignalSMA+")    !! :)");
   SetIndexLabel(0,"MACD YO");
   SetIndexLabel(1,"Signal YO");
   SetIndexLabel(2,"H I S T O :):)");
//---- initialization done
   return(0);
  }
//+------------------------------------------------------------------+
//| Moving Averages Convergence/Divergence                           |
//+------------------------------------------------------------------+
int start()
  {
   int limit;
   int counted_bars=IndicatorCounted();
//---- last counted bar will be recounted
   if(counted_bars>0) counted_bars--;
   limit=Bars-counted_bars;
//---- macd counted in the 1-st buffer
   for(int i=0; i<limit; i++)
      MacdBuffer[i]=iMA(NULL,0,FastEMA,0,MODE_EMA,PRICE_CLOSE,i)-iMA(NULL,0,SlowEMA,0,MODE_EMA,PRICE_CLOSE,i);
//---- signal line counted in the 2-nd buffer
   for(i=0; i<limit; i++)
      SignalBuffer[i]=iMAOnArray(MacdBuffer,Bars,SignalSMA,0,MODE_SMA,i);
//---- histogram line counted in the 3-nd buffer
   for(i=0; i<limit; i++)
      HistoBuffer[i]=MacdBuffer[i]-SignalBuffer[i];
//---- done
   return(0);
  }
//+------------------------------------------------------------------+
Comments