MACD_3_DEMA
Download script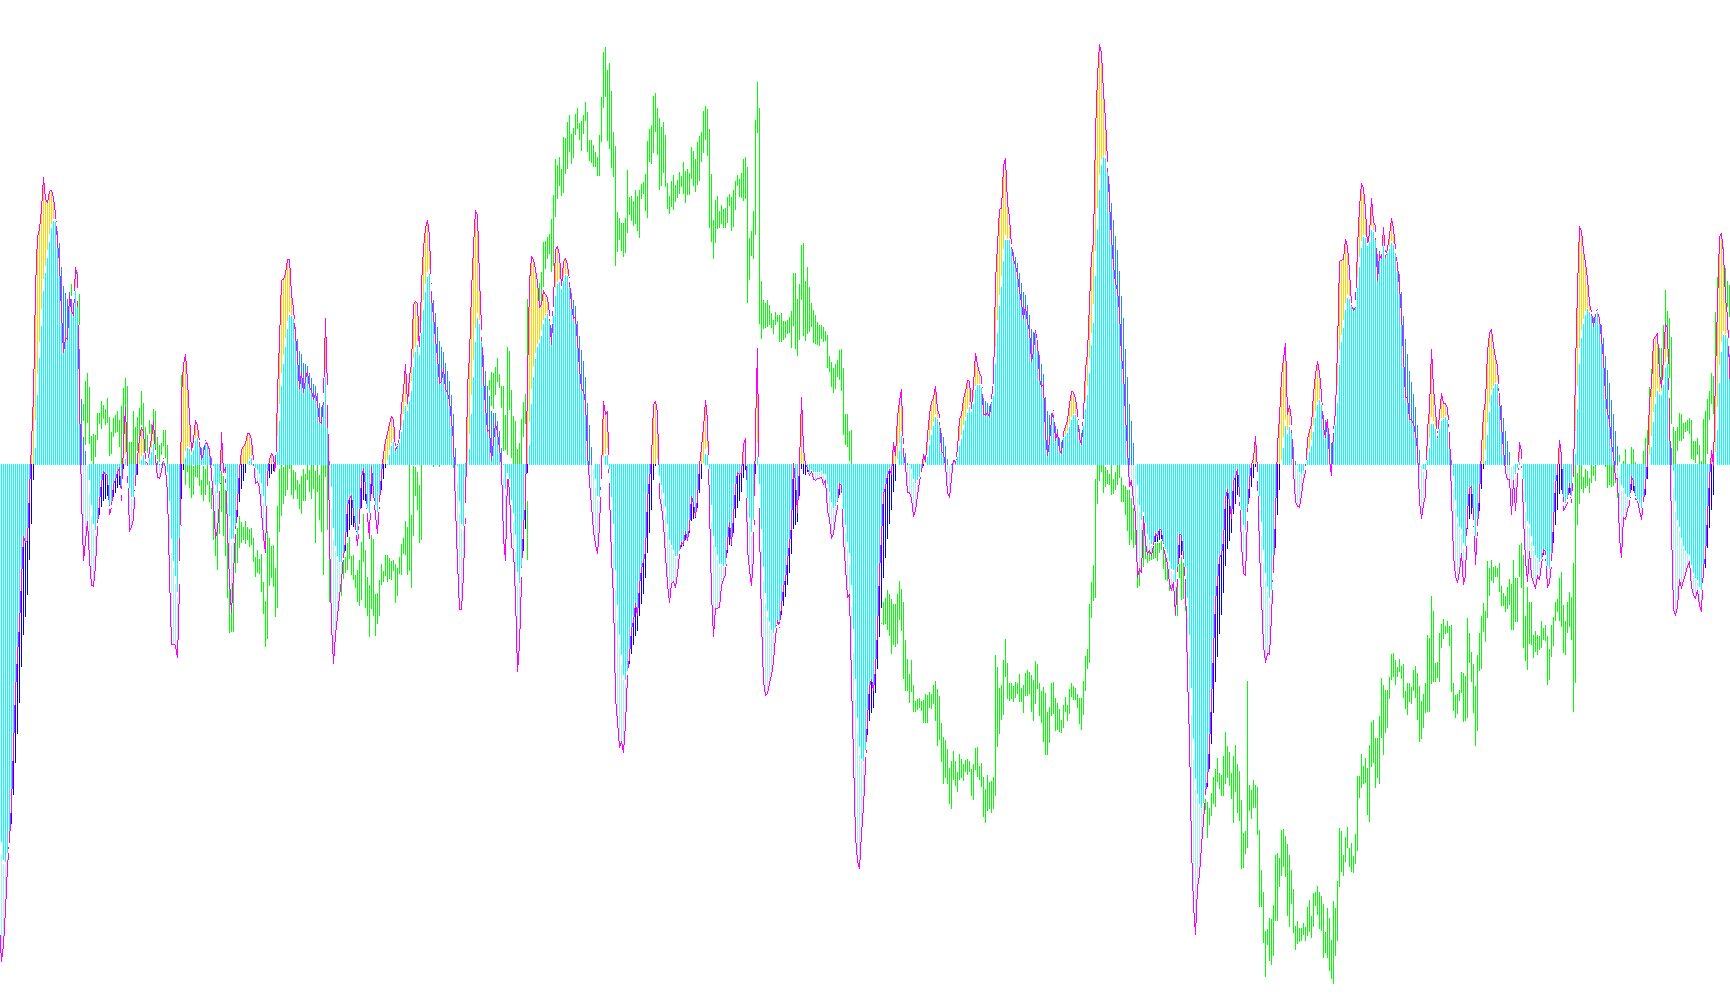
This custom indicator is designed to provide traders with a visual representation of momentum by analyzing the relationship between three different moving averages. By comparing these averages, the script identifies trends and potential turning points in price action.
Core Logic and Mechanism
The tool operates by calculating two distinct "momentum scores" based on a set of time periods (Fast 1, Fast 2, and Slow). It measures the distance between a faster-moving average and a significantly slower one. There are two modes for these calculations:
- DEMA Mode: Uses a "Double Exponential Moving Average," which is designed to reduce the lag typically found in standard moving averages, making it more responsive to recent price changes.
- Standard EMA Mode: Uses a traditional Exponential Moving Average if the DEMA option is turned off.
Visual Representation and Signal Interpretation
The script translates these mathematical distances into a dynamic color-coded histogram. This allows for a quick visual assessment of market sentiment:
- Bullish Momentum (Blue Bars): When the first fast moving average is performing stronger than the second, the indicator displays in blue. This suggests a positive trend or upward momentum.
- Bearish Momentum (Red Bars): Conversely, when the second fast moving average takes the lead over the first, the bars turn red, signaling downward pressure or negative momentum.
- Zero-Line Dynamics: The script also monitors whether these momentum scores are above or below the "zero" neutral line. It specifically highlights instances where momentum is moving in opposite directions relative to the zero mark using a black highlighting effect. This helps traders identify specific nuances in price exhaustion or crossovers.
Summary for the Trader
Essentially, this indicator simplifies complex trend analysis by consolidating three moving averages into a single, color-coded histogram. Instead of looking at multiple lines across a chart, you can quickly identify the prevailing market direction and the strength of that move based on the color and position of the bars.
//+------------------------------------------------------------------+
//|                                                  MACD_3_DEMA.mq4 |
//+------------------------------------------------------------------+
#property link "http://www.forexfactory.com/showthread.php?t=29419"
#property indicator_separate_window
#property indicator_buffers 7
#property indicator_level1  0.0
#property indicator_color1  Blue
#property indicator_color2  Blue
#property indicator_color3  Red
#property indicator_color4  Red
#property indicator_color5  Black
#property indicator_color6  SkyBlue
#property indicator_color7  Tomato
#property indicator_width1  2
#property indicator_width2  2
#property indicator_width3  2
#property indicator_width4  2
#property indicator_width5  5
#property indicator_width6  2
#property indicator_width7  2

//---- input parameters
extern int	Fast1	= 5,
            Fast2	= 13,
				Slow	= 50;
extern bool DEMAs	= true;

//---- indicator buffers
double	Fast1_Buffer[],
			Fast2_Buffer[],
			Blue1_Buffer[],
			Blue2_Buffer[],
			Red1_Buffer[],
			Red2_Buffer[],
			Black_Buffer[];

//+------------------------------------------------------------------+
//| Custom indicator initialization function                         |
//+------------------------------------------------------------------+
int init()
{
	IndicatorShortName("MACD of 3 DEMAs("+Fast1+","+Fast2+","+Slow+")");
	IndicatorBuffers(7);

//---- indicator buffers
	SetIndexStyle(0,DRAW_HISTOGRAM);
	SetIndexStyle(1,DRAW_HISTOGRAM);
	SetIndexStyle(2,DRAW_HISTOGRAM);
	SetIndexStyle(3,DRAW_HISTOGRAM);
	SetIndexStyle(4,DRAW_HISTOGRAM);
	SetIndexStyle(5,DRAW_LINE);
	SetIndexStyle(6,DRAW_LINE);
	SetIndexBuffer(0,Blue1_Buffer);
	SetIndexBuffer(1,Blue2_Buffer);
	SetIndexBuffer(2,Red1_Buffer);
	SetIndexBuffer(3,Red2_Buffer);
	SetIndexBuffer(4,Black_Buffer);
	SetIndexBuffer(5,Fast1_Buffer);
	SetIndexBuffer(6,Fast2_Buffer);
}

int start()
{
	int limit = MathMax(Bars-1-IndicatorCounted(),0);

//---- DEMAs and MACD
	for(int i = limit; i >= 0; i--)
	{
		if(DEMAs)
		{
			Fast1_Buffer[i] = iCustom(NULL,0,"DEMA",Fast1,0,i)-
									iCustom(NULL,0,"DEMA",Slow, 0,i);
			Fast2_Buffer[i] = iCustom(NULL,0,"DEMA",Fast2,0,i)-
									iCustom(NULL,0,"DEMA",Slow, 0,i);
		}
		else
		{
			Fast1_Buffer[i] = iMA(NULL,0,Fast1,0,MODE_EMA,PRICE_CLOSE,i)-
									iMA(NULL,0,Slow, 0,MODE_EMA,PRICE_CLOSE,i);
			Fast2_Buffer[i] = iMA(NULL,0,Fast2,0,MODE_EMA,PRICE_CLOSE,i)-
									iMA(NULL,0,Slow, 0,MODE_EMA,PRICE_CLOSE,i);
		}

		Black_Buffer[i]= 0.0;
		Blue1_Buffer[i]= 0.0;
		Blue2_Buffer[i]= 0.0;
		Red1_Buffer[i]	= 0.0;
		Red2_Buffer[i]	= 0.0;

	//---- Colored Bars
		if(Fast1_Buffer[i] > Fast2_Buffer[i])
		{
			Blue1_Buffer[i] = Fast1_Buffer[i];
			Blue2_Buffer[i] = Fast2_Buffer[i];

			if(Fast1_Buffer[i] < 0.0)
				Black_Buffer[i] = Fast1_Buffer[i];
			if(Fast2_Buffer[i] > 0.0)
				Black_Buffer[i] = Fast2_Buffer[i];
		}
		else
		{
			Red1_Buffer[i] = Fast1_Buffer[i];
			Red2_Buffer[i] = Fast2_Buffer[i];

			if(Fast1_Buffer[i] > 0.0)
				Black_Buffer[i] = Fast1_Buffer[i];
			if(Fast2_Buffer[i] < 0.0)
				Black_Buffer[i] = Fast2_Buffer[i];
		}

	}

//----
	return(0);
}
Comments