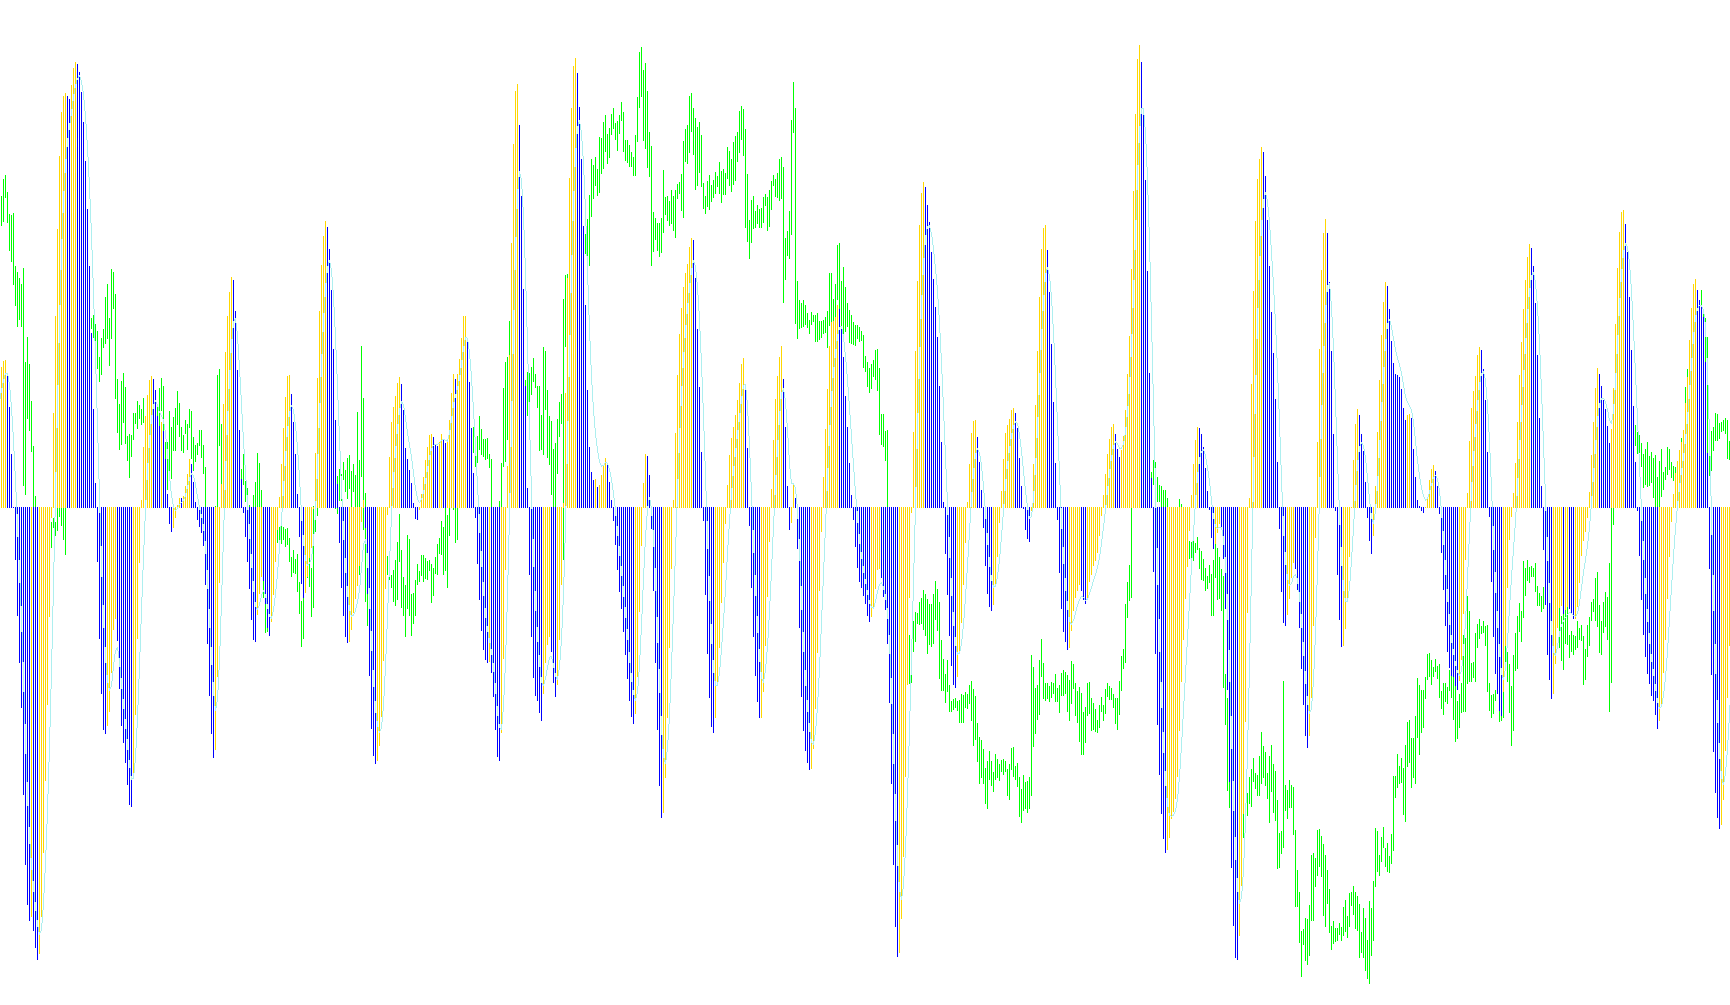
This tool is designed for traders who want to visualize market momentum and price trends through a specialized "Hull Moving Average" (HMA) histogram. Unlike standard moving averages that can often be slow to react to sudden market changes, the logic behind this script focuses on smoothing out price data while maintaining high sensitivity to current movements.
Core Logic Overview
The indicator operates by calculating two distinct moving average paths based on user-defined periods. It then performs a series of mathematical operations—including doubling, subtracting, and applying square root adjustments—to create a "Hull" effect. This specific method is intended to reduce the "lag" typically found in traditional indicators, allowing the visual output to stay closer to the actual price action.
How the Visuals Work
The script produces a histogram that changes behavior based on the direction of the trend:
- Momentum Detection: The tool calculates the difference between two complex moving averages. If the value is increasing, it signifies upward momentum; if decreasing, it signifies downward momentum.
- Dynamic Coloring: The histogram uses color to provide an immediate visual cue for the trend.
- When the momentum is moving upward, the histogram displays in one color (Dark Violet).
- When the momentum turns downward, it switches to another (Orange/Red).
- Signal Smoothing: To ensure the visual output isn't too "jittery" or noisy, the script applies a final smoothing pass (based on a secondary period) to create a signal line that helps filter out minor market fluctuations.
Key Features for the User
- Multi-Timeframe Capability: The logic allows the tool to look at data from different timeframes than the one currently displayed on your chart, giving you a broader perspective of the market.
- Customizable Sensitivity: You can adjust the periods and methods (such as Simple, Exponential, or Linear Weighted) to tune how quickly or slowly the indicator reacts to price changes.
- Trend Continuity: The script includes specific logic to maintain the previous histogram value if there is no significant change in momentum, ensuring a smooth visual transition on your chart.
In summary, this script acts as a trend-following oscillator. It identifies whether the "weight" of the price movement is shifting up or down and translates that energy into a color-coded histogram, helping you identify the current market direction at a glance.
//+------------------------------------------------------------------+
//|                                                    HMA histo.mq4 |
//|                                                           mladen |
//+------------------------------------------------------------------+
//mod2009fxtsd macd
#property copyright "mladen"
#property link ""

#property indicator_separate_window
#property indicator_buffers 3
#property indicator_color1  DarkViolet
#property indicator_color2  Orange
#property indicator_color3  Red
#property indicator_width1  1
#property indicator_width2  1
#property indicator_width3  1

//
//
//
//
//

extern int  HMA_Period1    = 21;
extern int  HMA_Period2    = 34;

extern int  HMA_Method1    = MODE_LWMA;
extern int  HMA_Method2    = MODE_LWMA;
extern int  HMA_PriceType1 =  0;
extern int  HMA_PriceType2 =  0;

extern int  smzPeriod    = 5;
extern int  smzMethod    = 1;

extern int TimeFrame = 0;

extern string  note_TimeFrames = "M1;5,15,30,60H1;240H4;1440D1;10080W1;43200MN|0-CurrentTF";
extern string  MA_Method_Price = "SMA0 EMA1 SMMA2 LWMA3||0O,1C 2H3L,4Md 5Tp 6WghC: Md(HL/2)4,Tp(HLC/3)5,Wgh(HLCC/4)6";
string IndicatorFileName;

//
//
//
//
//

double ind_buffer1[];
double ind_buffer2[];
double sig_buffer[];
double buffer0[];
double buffer1[];
double buffer2[];


//+------------------------------------------------------------------
//|                                                                 |
//+------------------------------------------------------------------

int init()
{

   //
   //
   //
   //
   //
   TimeFrame=MathMax(TimeFrame, Period());

   IndicatorShortName("HMA CD ("+HMA_Period1+","+HMA_Period2+","+smzPeriod+") M"+TimeFrame);

   IndicatorBuffers(6);
   SetIndexBuffer(0,ind_buffer1);
   SetIndexBuffer(1,ind_buffer2);
   SetIndexBuffer(2,sig_buffer);
   SetIndexBuffer(3,buffer0);
   SetIndexBuffer(4,buffer1);
   SetIndexBuffer(5,buffer2);
   SetIndexStyle(0,DRAW_HISTOGRAM);
   SetIndexStyle(1,DRAW_HISTOGRAM);
   SetIndexStyle(2,DRAW_LINE);

   int draw_begin=smzPeriod+HMA_Period1+HMA_Period2;
   for (int i = 0; i < indicator_buffers; i++)
   {
         SetIndexDrawBegin(i,draw_begin);
         SetIndexLabel(i,"Hull Moving Average");
   }

   IndicatorFileName = WindowExpertName();

   return(0);
}


//+------------------------------------------------------------------+
//|                                                                  |
//+------------------------------------------------------------------+

int start()
{
   int HalfPeriod1   = MathFloor(HMA_Period1/2);
   int HullPeriod1   = MathFloor(MathSqrt(HMA_Period1));

   int HalfPeriod2   = MathFloor(HMA_Period2/2);
   int HullPeriod2   = MathFloor(MathSqrt(HMA_Period2));


   int counted_bars = IndicatorCounted();
   int limit,i;


   if(counted_bars<0) return(-1);
   if(counted_bars>0) counted_bars--;
      limit=Bars-counted_bars;


   if (TimeFrame != Period())
      {
         limit = MathMax(limit,TimeFrame/Period());

          for(i=limit; i>=0; i--)
          {
            int y = iBarShift(NULL,TimeFrame,Time[i]);
            ind_buffer1[i] = iCustom(NULL,TimeFrame,IndicatorFileName,HMA_Period1,HMA_Period2,HMA_Method1,HMA_Method2,HMA_PriceType1,HMA_PriceType2,smzPeriod,smzMethod,0,y);
            ind_buffer2[i] = iCustom(NULL,TimeFrame,IndicatorFileName,HMA_Period1,HMA_Period2,HMA_Method1,HMA_Method2,HMA_PriceType1,HMA_PriceType2,smzPeriod,smzMethod,1,y);
            sig_buffer[i]  = iCustom(NULL,TimeFrame,IndicatorFileName,HMA_Period1,HMA_Period2,HMA_Method1,HMA_Method2,HMA_PriceType1,HMA_PriceType2,smzPeriod,smzMethod,2,y);


          }

         return(0);
      }


   for(i=limit; i>=0; i--)
   {
         buffer1[i]=iMA(NULL,0,HalfPeriod1,0,HMA_Method1,HMA_PriceType1,i)*2-
                    iMA(NULL,0,HMA_Period1,0,HMA_Method1,HMA_PriceType1,i);

         buffer2[i]=iMA(NULL,0,HalfPeriod2,0,HMA_Method2,HMA_PriceType2,i)*2-
                    iMA(NULL,0,HMA_Period2,0,HMA_Method2,HMA_PriceType2,i);
   }


   for(i=limit; i>=0; i--)

         buffer0[i] =  iMAOnArray(buffer1,0,HullPeriod1,0,HMA_Method1,i)-
                       iMAOnArray(buffer2,0,HullPeriod2,0,HMA_Method2,i);

   for(i=limit; i>=0; i--)
   {
      sig_buffer[i]  =  iMAOnArray(buffer0,0,smzPeriod,0,smzMethod,i);


               ind_buffer1[i]=EMPTY_VALUE;   ind_buffer1[i]=EMPTY_VALUE;


      if (buffer0[i]>buffer0[i+1])  ind_buffer1[i]=buffer0[i];
      else
      if (buffer0[i]<buffer0[i+1])  ind_buffer2[i]=buffer0[i];
      else                      {
                                    ind_buffer1[i]=buffer1[i+1];
                                    ind_buffer2[i]=buffer2[i+1];
                                 }


   }

      //
      //
      //
      //
      //


   return(0);
}
Comments