Ma_Parabolic_st2
Download script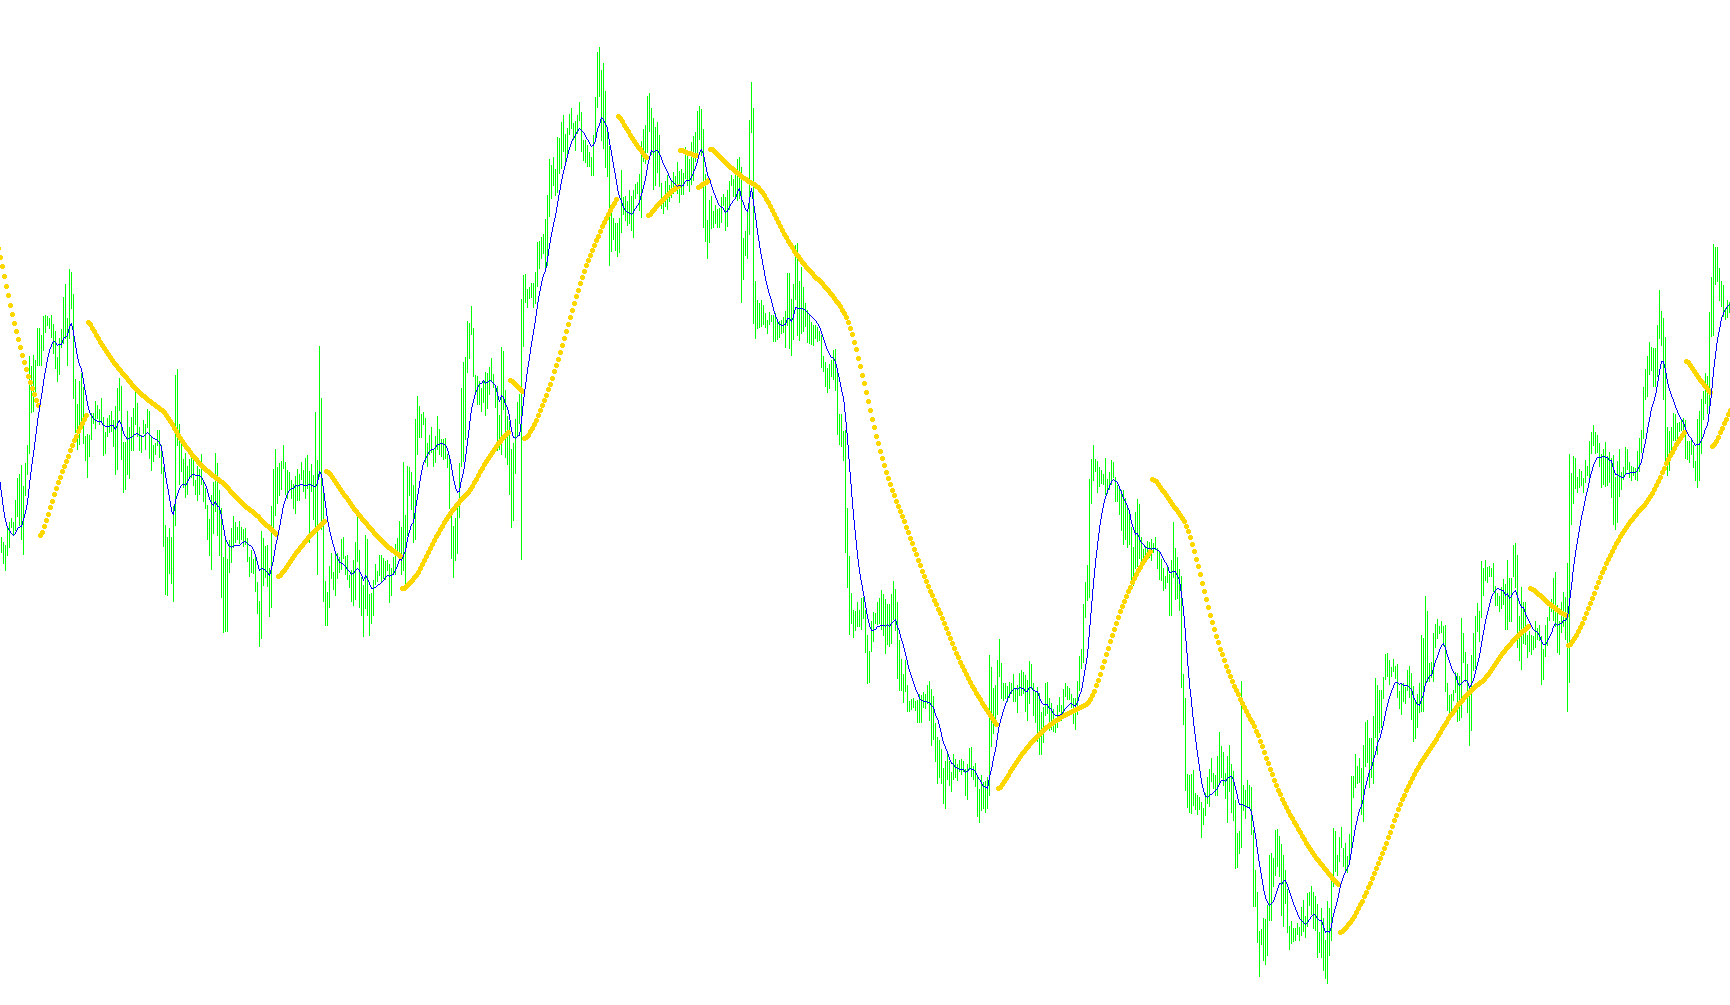
This script is a technical trading tool designed to help traders identify price trends and potential reversal points by combining two distinct types of moving averages. It visualizes these movements on a chart using both smooth lines and specific signal markers (arrows).
Core Components of the Logic
1. The Trend Foundation (Moving Average) The script starts by calculating a standard Moving Average based on a set period of time. This serves as the primary "base" for the price action. Instead of looking at raw market noise, the tool uses this average to smooth out fluctuations, providing a clearer picture of the general direction in which the asset is moving.
2. The Parabolic Momentum Tracker Layered on top of the base moving average is a more dynamic "Parabolic" calculation. Unlike a standard average that looks backward at historical data equally, this logic reacts to current price momentum. It behaves like a trailing tracker:
- Acceleration: When the price moves strongly in one direction (up or down), the tracker tightens its follow-up. It increases its sensitivity proportionally to keep pace with the speed of the move.
- Speed Limits: The script includes "Step" and "Maximum" parameters. These act as safety valves, ensuring that the tracker doesn't become overly sensitive or erratic during extreme volatility, keeping the signal consistent and reliable.
How the System Identifies Shifts
The primary goal of this logic is to detect when a trend is exhausted and about to flip. It does this by monitoring three specific conditions:
- Trend Detection: The script identifies whether the current market mood is bullish (upward) or bearish (downward).
- Reversal Monitoring:
- In an uptrend, it watches for the Parabolic tracker to drop toward or below the bottom of the price range. If this happens, it signals a potential reversal to a downtrend.
- In a downtrend, it watches for the tracker to rise toward or above the top of the price range. If this occurs, it signals a potential move back into an uptrend.
- Reset Mechanism: Every time a reversal is confirmed, the system "resets" its internal math. It clears the momentum gain and starts fresh from the new peak or trough, allowing it to begin tracking the new trend immediately.
Visual Output for the User
The logic translates these complex mathematical shifts into two visual elements on your trading screen:
- A Continuous Line: This shows the smoothed moving average, helping you see the "flow" of the market.
- Directional Arrows: When the Parabolic logic detects a confirmed trend reversal (where the price action breaks the tracker's path), it places an arrow on the chart. These serve as clear visual cues for where the script believes the momentum has shifted from one direction to the other.
//+------------------------------------------------------------------+
//|                                             Ma-Parabolic_st2.mq4 |
//|                      Copyright © 2008, MetaQuotes Software Corp. |
//|                      Copyright © 2008, Ëóêàøóê Â.Ã. aka lukas1.  |
//+------------------------------------------------------------------+
#property copyright "Copyright © 2008, MetaQuotes + lukas1"

#property indicator_chart_window
#property indicator_buffers 2
#property indicator_color1 Orchid
#property indicator_color2 Maroon
//---- input parameters
extern int    Ma=14;
extern int    method=3;
extern int    app_price=0;
extern double Step=0.02;
extern double Maximum=0.04;
//---- buffers
double SarBuffer[];
double MaBuffer[];
//----
static bool first=false;
bool   dirlong;
double start,last_high,last_low;
double ep,sar,price_low,price_high;
int    i,j;
//+------------------------------------------------------------------+
//| Custom indicator initialization function                         |
//+------------------------------------------------------------------+
int init()
  {
//---- indicators
   IndicatorDigits(Digits);
   string SS=DoubleToStr(Step,4);
   string MM=DoubleToStr(Maximum,4);
   SetIndexLabel(0,"Step= "+SS+", Max= "+MM);
   SetIndexStyle(0,DRAW_ARROW);
   SetIndexArrow(0,159);
   SetIndexBuffer(0,SarBuffer);
   SetIndexDrawBegin(0, 4/Step);
//----
   SetIndexLabel(1,"period= "+Ma);
   SetIndexStyle(1,DRAW_LINE);
   SetIndexBuffer(1,MaBuffer);
   SetIndexDrawBegin(0, 4/Step+Ma);
//----
   return(0);
  }
//+------------------------------------------------------------------+
//| Parabolic Sell And Reverse system                                |
//+------------------------------------------------------------------+
int start()
  {
   if(Bars<5) return(0);
   dirlong=true;
   start=Step;
//--------------------------------------------+
   for(j=Bars-4;j>=0;j--)
      MaBuffer[j] = iMA(Symbol(),0,Ma,0,method,app_price,j);

   int i=Bars-4;
   while(i>=0)
     {
      price_low=MaBuffer[i]-Point;
      price_high=MaBuffer[i]+Point;
      //sar ðàâåí öåíà ïðåäûäóùåãî áàðà ïëþñ øàã óìíîæèòü íà
      //(ñòàðàÿ öåíà ìèíóñ çíà÷åíèå SarBuffer ïðåäûäóùåãî áàðà)
      sar=SarBuffer[i+1]+start*(ep-SarBuffer[i+1]);
//----
      if(dirlong)//öåïî÷êà ââåðõ
        {
         if(ep<price_high && (start+Step)<=Maximum) start+=Step;
         if(sar>=price_low)//åñëè óñëîâèÿ äëÿ ïåðåêëþ÷åíèÿ íàñòóïèëè
           {
            start=Step;
            dirlong=false;
            ep=price_low;//óñòàíàâëèâàåì ïîñëåäíþþ öåíó = ìèíèìóì
            last_low=price_low;
            if(MaBuffer[i]+Point<last_high) SarBuffer[i]=last_high;
            else SarBuffer[i]=MaBuffer[i]+Point;
            i--;
            continue;
           }
         else
           {
            if(ep<price_low && (start+Step)<=Maximum) start+=Step;
            //è ïåðåñ÷èòûâàåì last_high è ep äëÿ ðàñ÷åòà ñëåäóþùåé òî÷êè ìàêñèìóìà
            if(ep<price_high) { last_high=price_high; ep=price_high; }
           }
        }
//----
      else//öåïî÷êà âíèç
        {
         if(ep>price_low && (start+Step)<=Maximum) start+=Step;
         if(sar<=price_high)//åñëè íàñòóïèëè óñëîâèÿ ïåðåêëþ÷åíèÿ
           {
            start=Step;
            dirlong=true;
            ep=price_high;//óñòàíàâëèâàåì ïîñëåäíþþ öåíó = ìàêñèìóì
            last_high=price_high;
            if(MaBuffer[i]-Point>last_low) SarBuffer[i]=last_low;
            else SarBuffer[i]=MaBuffer[i]-Point;
            i--;
            continue;
           }
         else
           {
            if(ep>price_high && (start+Step)<=Maximum) start+=Step;
            //åñëè óñëîâèÿ äëÿ ïåðåêëþ÷åíèÿ íå íàñòóïèëè
            //òî ïåðåñ÷èòûâàåì last_low è ep äëÿ ðàñ÷åòà ñëåäóþùåé òî÷êè ìèíèìóìà
            if(ep>price_low){last_low=price_low;ep=price_low;}
           }
        }
      SarBuffer[i]=sar;
      i--;
     }
//----
   return(0);
  }
//+------------------------------------------------------------------+
Comments