Laguerre_002
Download script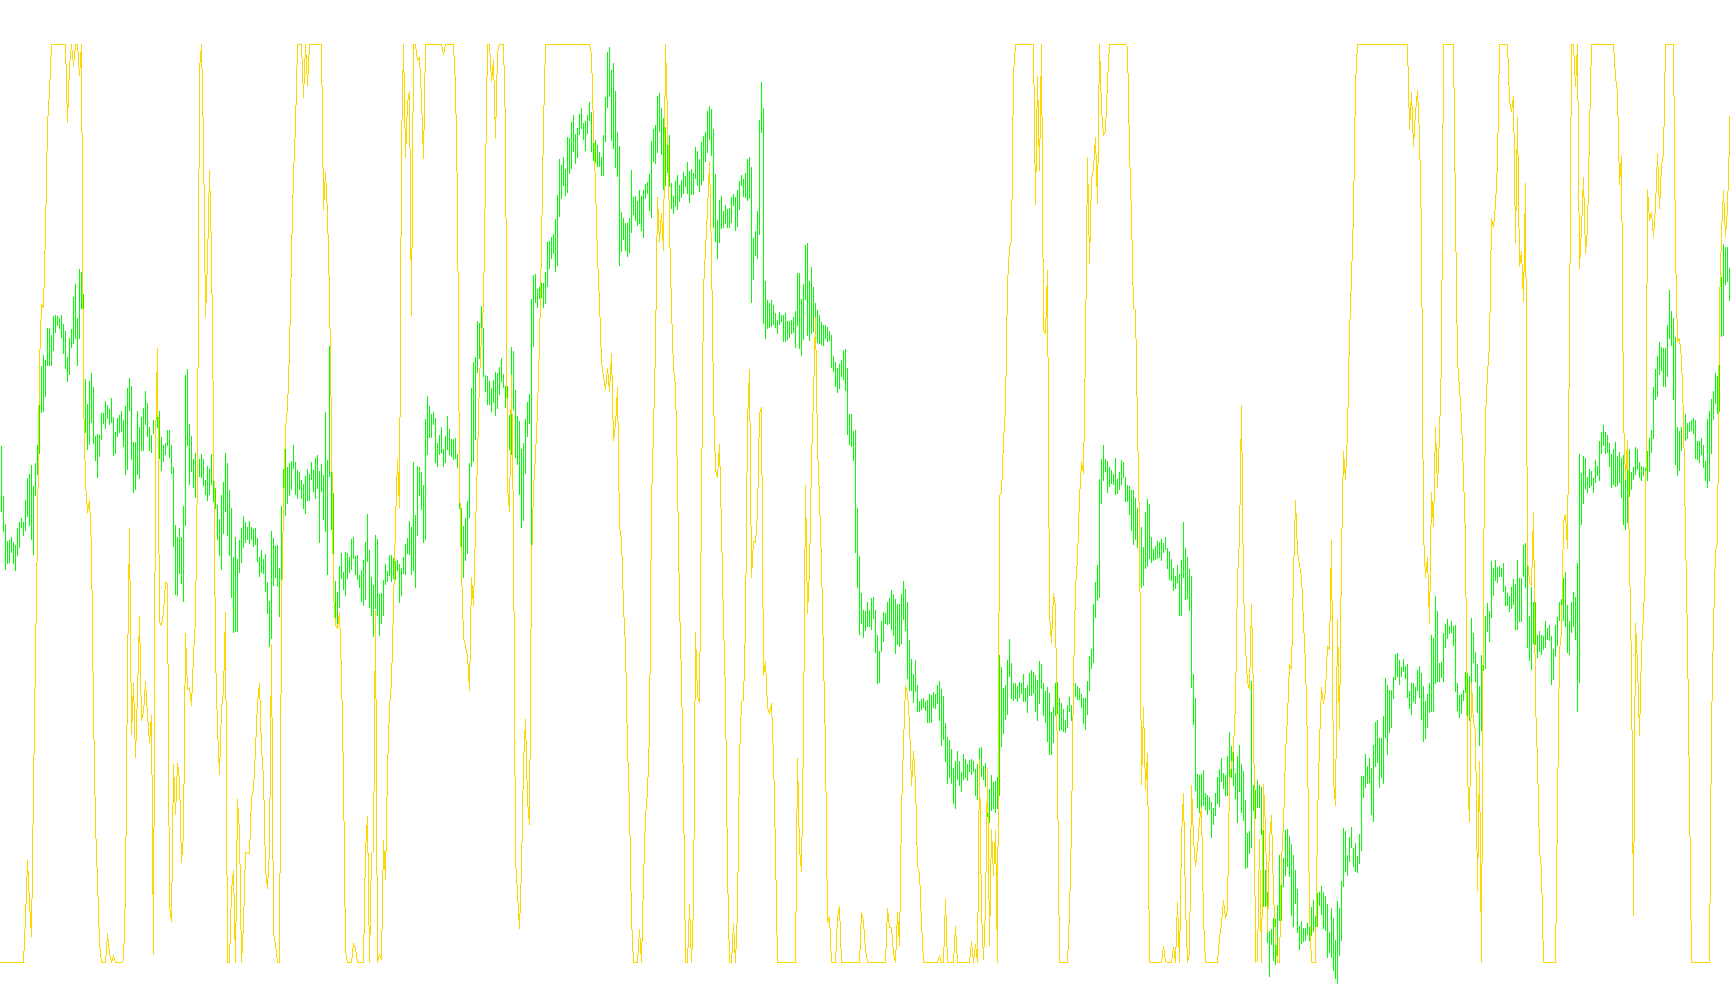
This script functions as a specialized technical analysis tool designed to measure and visualize momentum in financial markets. It processes historical price data to generate a smooth, oscillating value that helps traders identify the strength of current price trends relative to past movements.
Core Logic and Functionality
The indicator operates by analyzing the "Close" price of each candle over a specific period. Instead of simply looking at raw price changes, it uses a sophisticated recursive calculation to create four distinct layers of data (referred to internally as L0 through L3). These layers act as filters, smoothing out market noise while retaining the essential direction of the trend.
How the Calculation Works
- Trend Smoothing: The script applies a weighted factor (controlled by a "gamma" setting) to the price history. This creates a cascading effect where each new data point is balanced against previous values, allowing the indicator to react quickly to significant moves while remaining stable during periods of low volatility.
- Momentum Differentiation: Once these four smoothed layers are established, the script calculates the distance between them. It identifies whether the "upper" layers are moving faster than the "lower" layers.
- Relative Strength Calculation: The final output is a ratio. By comparing the sum of positive movements (upward momentum) against the sum of negative movements (downward momentum), the script produces a percentage-style value.
Visual Representation
The result is displayed in a separate window below the main price chart. The indicator oscillates between specific levels, providing a clear visual cue of market sentiment:
- When the values trend higher, it suggests prevailing upward momentum.
- When the values trend lower, it suggests prevailing downward momentum.
- The distinct horizontal levels (0.75, 0.45, and 0.15) serve as reference points to help traders identify overbought or oversold conditions, or to confirm when a trend is gaining significant strength.
By distilling complex price fluctuations into a single moving ratio, this tool allows for a clearer understanding of market dynamics, helping to distinguish between minor price "hiccups" and meaningful trend shifts.
//+------------------------------------------------------------------+
//|                                                     Laguerre.mq4 |
//|                                                     Emerald King |
//|                                     mailto:info@emerald-king.com |
//+------------------------------------------------------------------+
#property copyright "Emerald King"
#property link      "mailto:info@emerald-king.com"

#property indicator_separate_window
#property indicator_color1 Magenta
#property indicator_level2 0.75
#property indicator_level3 0.45
#property indicator_level4 0.15
//---- input parameters
extern double gamma=0.7;
extern int CountBars=950;

double L0 = 0;
double L1 = 0;
double L2 = 0;
double L3 = 0;
double L0A = 0;
double L1A = 0;
double L2A = 0;
double L3A = 0;
double LRSI = 0;
double CU = 0;
double CD = 0;

double val1[];
//+------------------------------------------------------------------+
//| Custom indicator initialization function                         |
//+------------------------------------------------------------------+

int init()
  {
//---- indicators
//----
   SetIndexBuffer(0,val1);
   return(0);
  }
//+------------------------------------------------------------------+
//| Custor indicator deinitialization function                       |
//+------------------------------------------------------------------+
int deinit()
  {
//---- TODO: add your code here

//----
   return(0);
  }
//+------------------------------------------------------------------+
//| Custom indicator iteration function                              |
//+------------------------------------------------------------------+
int start()
  {
   if (CountBars>Bars) CountBars=Bars;
   SetIndexDrawBegin(0,Bars-CountBars);

   int i;
   int    counted_bars=IndicatorCounted();

   //if(CountBars<=Lookback) return(0);
   //---- initial zero
   //if(counted_bars<1)
   //{
   //   for(i=1;i<=Lookback;i++) val1[CountBars-i]=0.0;
   //}

   i=CountBars-1;
   while(i>=0)
   {
      L0A = L0;
      L1A = L1;
      L2A = L2;
      L3A = L3;
      L0 = (1 - gamma)*Close[i] + gamma*L0A;
      L1 = - gamma *L0 + L0A + gamma *L1A;
      L2 = - gamma *L1 + L1A + gamma *L2A;
      L3 = - gamma *L2 + L2A + gamma *L3A;

      CU = 0;
      CD = 0;

      if (L0 >= L1) CU = L0 - L1; else CD = L1 - L0;
      if (L1 >= L2) CU = CU + L1 - L2; else CD = CD + L2 - L1;
      if (L2 >= L3) CU = CU + L2 - L3; else CD = CD + L3 - L2;

      if (CU + CD != 0) LRSI = CU / (CU + CD);
      val1[i] = LRSI;
	  i--;
	}
   return(0);
 }
//+------------------------------------------------------------------+
Comments