LSMAx
Download script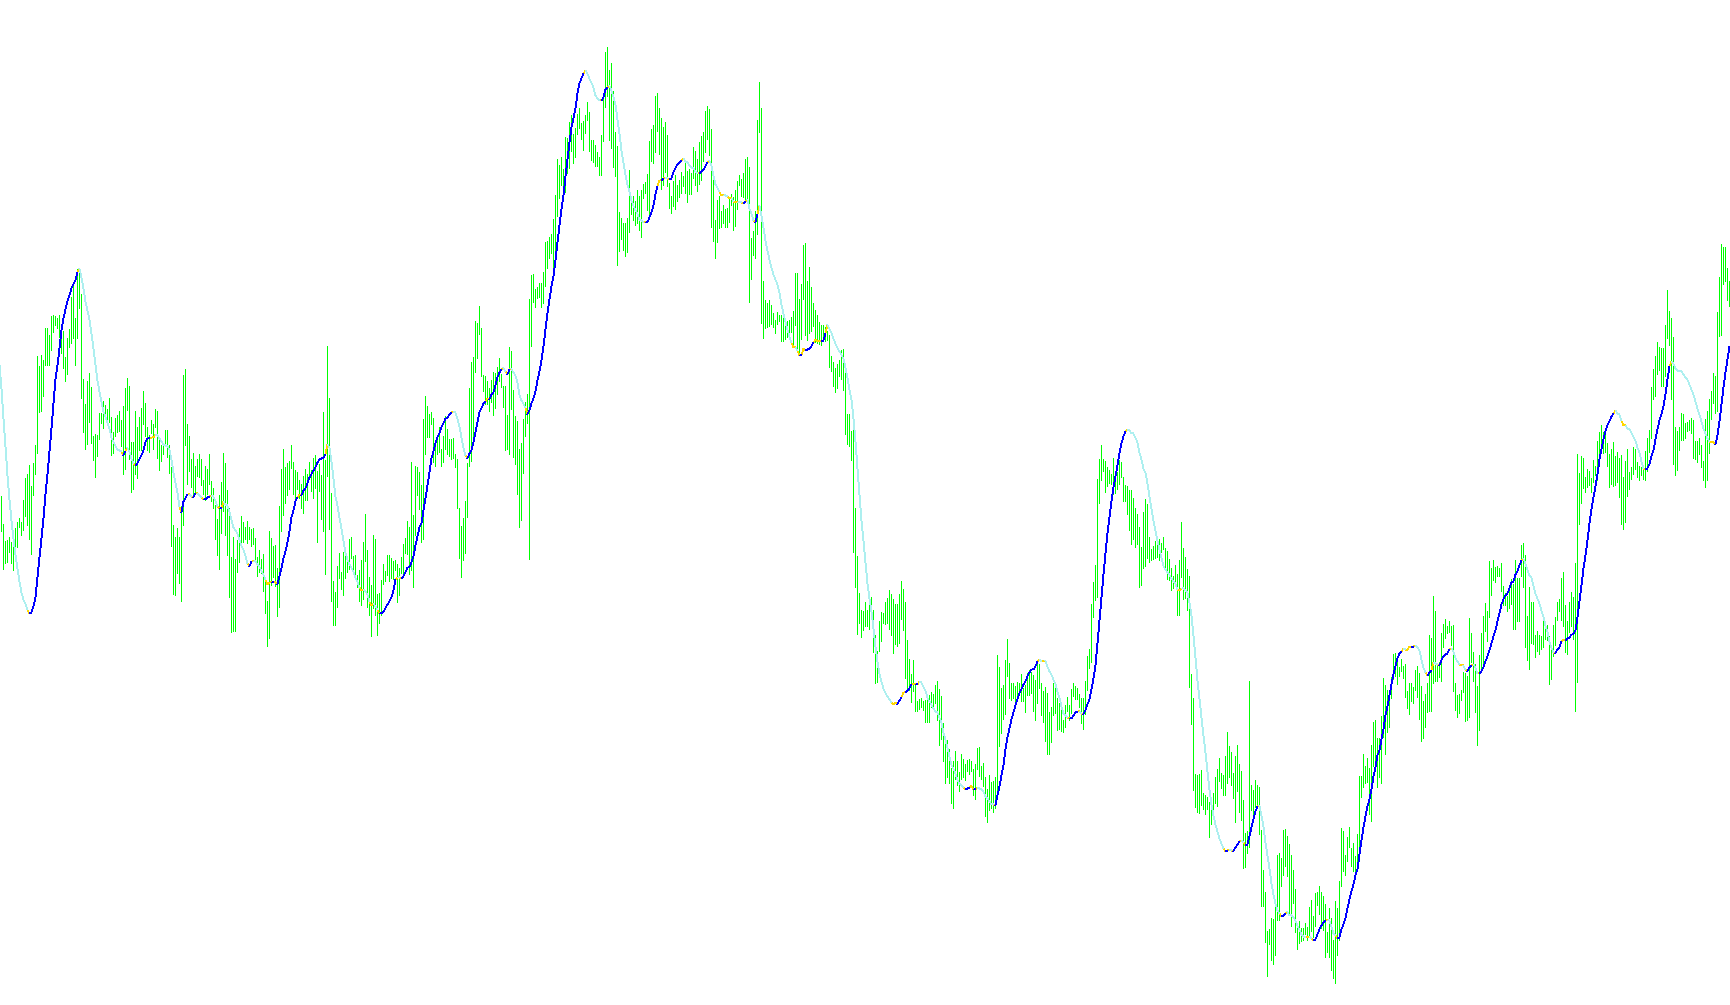
This script is designed as a visual analysis tool for trading charts, specifically engineered to help traders identify the prevailing trend of a financial asset. It operates by calculating a weighted moving average, which provides a smoother and more responsive view of price action compared to standard averages.
Core Logic and Functionality
The primary objective of this script is to interpret historical price data and translate it into distinct visual signals on your chart. Here is how the logic flows:
1. Data Processing The tool looks back at a specific number of recent price bars (defined by the period setting). Instead of simply averaging these prices, the script applies a weighted calculation. This means it assigns different levels of importance to different price points within that window, allowing the indicator to react more fluidly to recent movements while still maintaining a connection to broader trends.
2. Trend Detection Once the weighted value is calculated for each point on the chart, the script compares the current value against the previous one. It identifies whether the trend is moving upward, downward, or remains stagnant:
- Upward Movement: When the current value is higher than the previous one, the logic detects an increasing trend.
- Downward Movement: When the current value is lower than the previous one, the logic detects a decreasing trend.
3. Visual Representation The script translates these mathematical findings into clear visual cues on your screen:
- Dynamic Coloring: The tool manages three different visual buffers. Depending on whether the trend is rising or falling, it "activates" specific colors (such as Lime for upward movements and Red for downward movements) and "hides" the others.
- Seamless Continuity: By dynamically switching which color is visible based on the direction of the weighted average, the script creates a continuous line that changes color to signal shifts in market momentum.
Summary for the User
Essentially, this tool acts as a visual guide. It filters out minor "market noise" by using a weighted moving average and then paints the trendline clearly: one color represents strength moving up, and another represents strength moving down. This allows you to see at a glance whether the current market environment is bullish or bearish without having to manually interpret raw price fluctuations.
/*-----------------------------+
|			       |
| Shared by www.Aptrafx.com    |
|			       |
+------------------------------*/

//+------------------------------------------------------------------+
//|                      Copyright © 2004, MetaQuotes Software Corp. |
//|                                       http://www.metaquotes.net/ |
//+------------------------------------------------------------------+

#property copyright "Copyright © 2004, MetaQuotes Software Corp."
#property link "http://www.metaquotes.net"
#property indicator_chart_window
#property indicator_buffers 3
#property indicator_color1 Black
#property indicator_color2 Lime
#property indicator_color3 Red

double ExtMapBuffer0[];
double ExtMapBuffer1[];
double ExtMapBuffer2[];

extern int Rperiod = 34;

int width;
int Draw4HowLong;
int shift;
int i;
int loopbegin;
int length;

double lengthvar;
double tmp ;
double sum[];
double wt[];
int c;

//+------------------------------------------------------------------+
//| Custom indicator initialization function |
//+------------------------------------------------------------------+

int init()
{
	IndicatorBuffers(5);

	SetIndexBuffer(2,ExtMapBuffer0);
	SetIndexBuffer(1,ExtMapBuffer1);
	SetIndexBuffer(0,ExtMapBuffer2);
	SetIndexBuffer(3,sum);
	SetIndexBuffer(4,wt);


	// Start line => dot changes
	/*
	SetIndexStyle(0,DRAW_ARROW,0,1);
	SetIndexStyle(1,DRAW_ARROW,0,1);
	SetIndexStyle(2,DRAW_ARROW,0,1);

	SetIndexArrow(0,159);
	SetIndexArrow(1,159);
	SetIndexArrow(2,159);

	SetIndexLabel(0,"MAnone");
	SetIndexLabel(1,"MAup");
	SetIndexLabel(1,"MAdown");
	*/
	// End line => dot changes, Start old code:

	SetIndexStyle(2,DRAW_LINE,STYLE_SOLID,2);
	SetIndexStyle(1,DRAW_LINE,STYLE_SOLID,2);
	SetIndexStyle(0,DRAW_LINE,STYLE_SOLID,2);

	// End old code

	return(0);
}

int start()
{
	Draw4HowLong = Bars - Rperiod - 5;
	length = Rperiod;
	loopbegin = Draw4HowLong - length - 1;

	for(shift = loopbegin; shift >= 1; shift--)
	{
		sum[1] = 0;
		for(i = length; i >= 1 ; i--)
		{
			lengthvar = length + 1;
			lengthvar /= 3;
			tmp = 0;
			tmp = ( i - lengthvar)*Close[length-i+shift];
			sum[1]+=tmp;
		}
		wt[shift] = sum[1]*6/(length*(length+1));

		ExtMapBuffer2[shift] = wt[shift]; //red
		ExtMapBuffer1[shift] = wt[shift]; //green
		ExtMapBuffer0[shift] = wt[shift]; //yellow

		if (wt[shift+1] > wt[shift])
		{
			ExtMapBuffer1[shift+1] = EMPTY_VALUE;
		}
		else if (wt[shift+1] < wt[shift])
		{
			ExtMapBuffer0[shift+1] = EMPTY_VALUE;
		}
		else
		{
			ExtMapBuffer0[shift+1]=CLR_NONE;
			ExtMapBuffer1[shift+1]=CLR_NONE;
		}
	}

	return(0);
}
Comments