Laguerre1Alert_002
Download script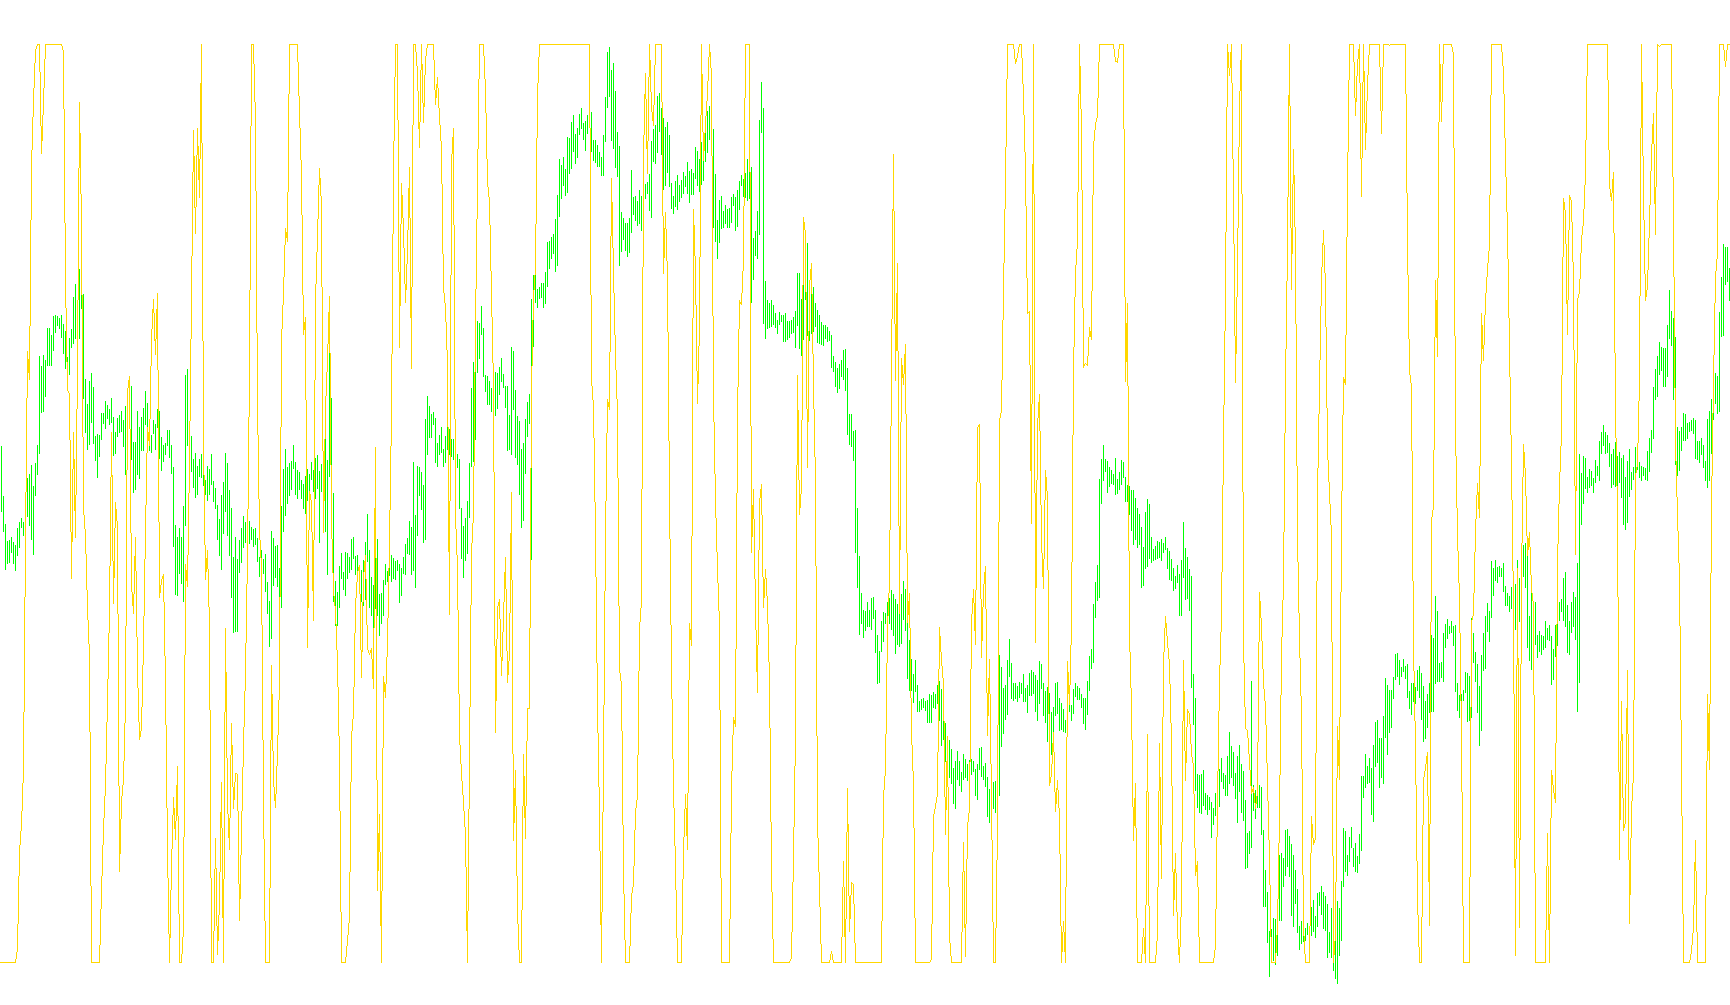
This tool is a custom technical analysis indicator designed to help traders identify potential momentum shifts and trend reversals in the financial markets. By smoothing out market noise, it provides a clearer view of price action compared to standard moving averages.
How the Logic Works
The script operates by processing historical price data through a specific mathematical filter known as a Laguerre-based calculation. Here is a breakdown of how it functions:
1. Data Smoothing and Processing Instead of looking only at the most recent price, the script looks back at a significant amount of historical data (the "CountBars" setting). It uses a specific coefficient (gamma) to calculate a series of weighted values. This process helps identify the underlying "flow" of the market, making it easier to see whether the price is trending upward, downward, or moving sideways.
2. Momentum Measurement The indicator calculates the relative difference between these weighted values. It essentially measures the "velocity" of the price movement. By comparing these different layers of data against each other, it generates a numerical value (LRSI) that fluctuates within a specific range. This value acts as a momentum oscillator:
- When the value moves toward the top of the scale, it suggests strong upward momentum.
- When the value moves toward the bottom, it suggests strong downward momentum.
3. Visual Reference Levels The tool provides three distinct horizontal levels to help traders stay disciplined:
- Sell Level (0.85): Represents a zone of "overbought" momentum.
- Buy Level (0.15): Represents a zone of "oversold" momentum.
- Mid-Range Levels: Provide visual checkpoints to monitor the strength of current trends.
4. Automated Alerts and Signals The core utility of this script is its ability to detect "crossovers." The logic monitors for specific moments where the momentum has reached an extreme level and begins to turn back in the opposite direction:
- Sell Signal: If the momentum was above the Sell Level but then drops back below it, the script recognizes a potential loss of upward strength and triggers a "Sell" alert.
- Buy Signal: If the momentum was below the Buy Level but then rises back above it, the script recognizes a potential gain in upward strength and triggers a "Buy" alert.
Summary for the Trader
Think of this indicator as a sophisticated "speedometer" for market trends. Rather than just telling you where the price is, it tells you how fast and in what direction the price is moving relative to its recent history. When the "speed" hits an extreme and starts to slow down or reverse, the script alerts you, potentially identifying high-probability entry points for trades.
//+------------------------------------------------------------------+
//|                                                     Laguerre.mq4 |
//|                                                     Emerald King |
//|                                     mailto:info@emerald-king.com |
//+------------------------------------------------------------------+
#property copyright "Emerald King"
#property link      "mailto:info@emerald-king.com"


#property indicator_separate_window
#property indicator_minimum -0.1
#property indicator_maximum  1.1
#property indicator_color1 DodgerBlue
#property indicator_width1 3
#property indicator_level2 0.85
#property indicator_level3 0.45
#property indicator_level4 0.15

//---- input parameters
extern double  gamma=0.55;
extern int     CountBars=9500;
extern double  BuyLevel=0.15;
extern double  SellLevel=0.85;
extern bool    UseAlertSound=true;
datetime TimeStamp;

double L0 = 0;
double L1 = 0;
double L2 = 0;
double L3 = 0;
double L0A = 0;
double L1A = 0;
double L2A = 0;
double L3A = 0;
double LRSI = 0;
double CU = 0;
double CD = 0;

double val1[],
       ValBar1=0;
double alertBar;
double prev;

//+------------------------------------------------------------------+
//| Custom indicator initialization function                         |
//+------------------------------------------------------------------+

int init()
  {
//---- indicators
//----
   SetIndexBuffer(0,val1);
   return(0);
  }
//+------------------------------------------------------------------+
//| Custor indicator deinitialization function                       |
//+------------------------------------------------------------------+
int deinit()
  {
//---- TODO: add your code here

//----
   return(0);
  }
//+------------------------------------------------------------------+
//| Custom indicator iteration function                              |
//+------------------------------------------------------------------+
int start()
  {

   if (CountBars>Bars) CountBars=Bars;
   SetIndexDrawBegin(0,Bars-CountBars);

   int i;
   int    counted_bars=IndicatorCounted();

   i=CountBars-1;

   while(i>=0)
   {
      L0A = L0;
      L1A = L1;
      L2A = L2;
      L3A = L3;
      L0 = (1 - gamma)*Close[i] + gamma*L0A;
      L1 = - gamma *L0 + L0A + gamma *L1A;
      L2 = - gamma *L1 + L1A + gamma *L2A;
      L3 = - gamma *L2 + L2A + gamma *L3A;

      CU = 0;
      CD = 0;

      if (L0 >= L1) CU = L0 - L1; else CD = L1 - L0;
      if (L1 >= L2) CU = CU + L1 - L2; else CD = CD + L2 - L1;
      if (L2 >= L3) CU = CU + L2 - L3; else CD = CD + L3 - L2;

      if (CU + CD != 0) LRSI = CU / (CU + CD);
      val1[i] = LRSI;

      if(i==1) ValBar1=LRSI;
      if(prev != 1 && i==0 && ValBar1>SellLevel && LRSI<=SellLevel && Bars>alertBar)
      {
         Alert("Lagerre Sell "+ Symbol()+" Curr: ", LRSI," on ",Period());
         alertBar = Bars;prev = 2;
      }

      if(prev != 2 && i==0 && ValBar1<BuyLevel && LRSI>=BuyLevel && Bars>alertBar)
      {
         Alert("Lagerre Buy "+ Symbol()+" Curr: ", LRSI," On ",Period());
         alertBar = Bars;prev = 1;
      }

      i--;
	}
   return(0);
 }
//+------------------------------------------------------------------+
Comments