HMA_v07.1
Download script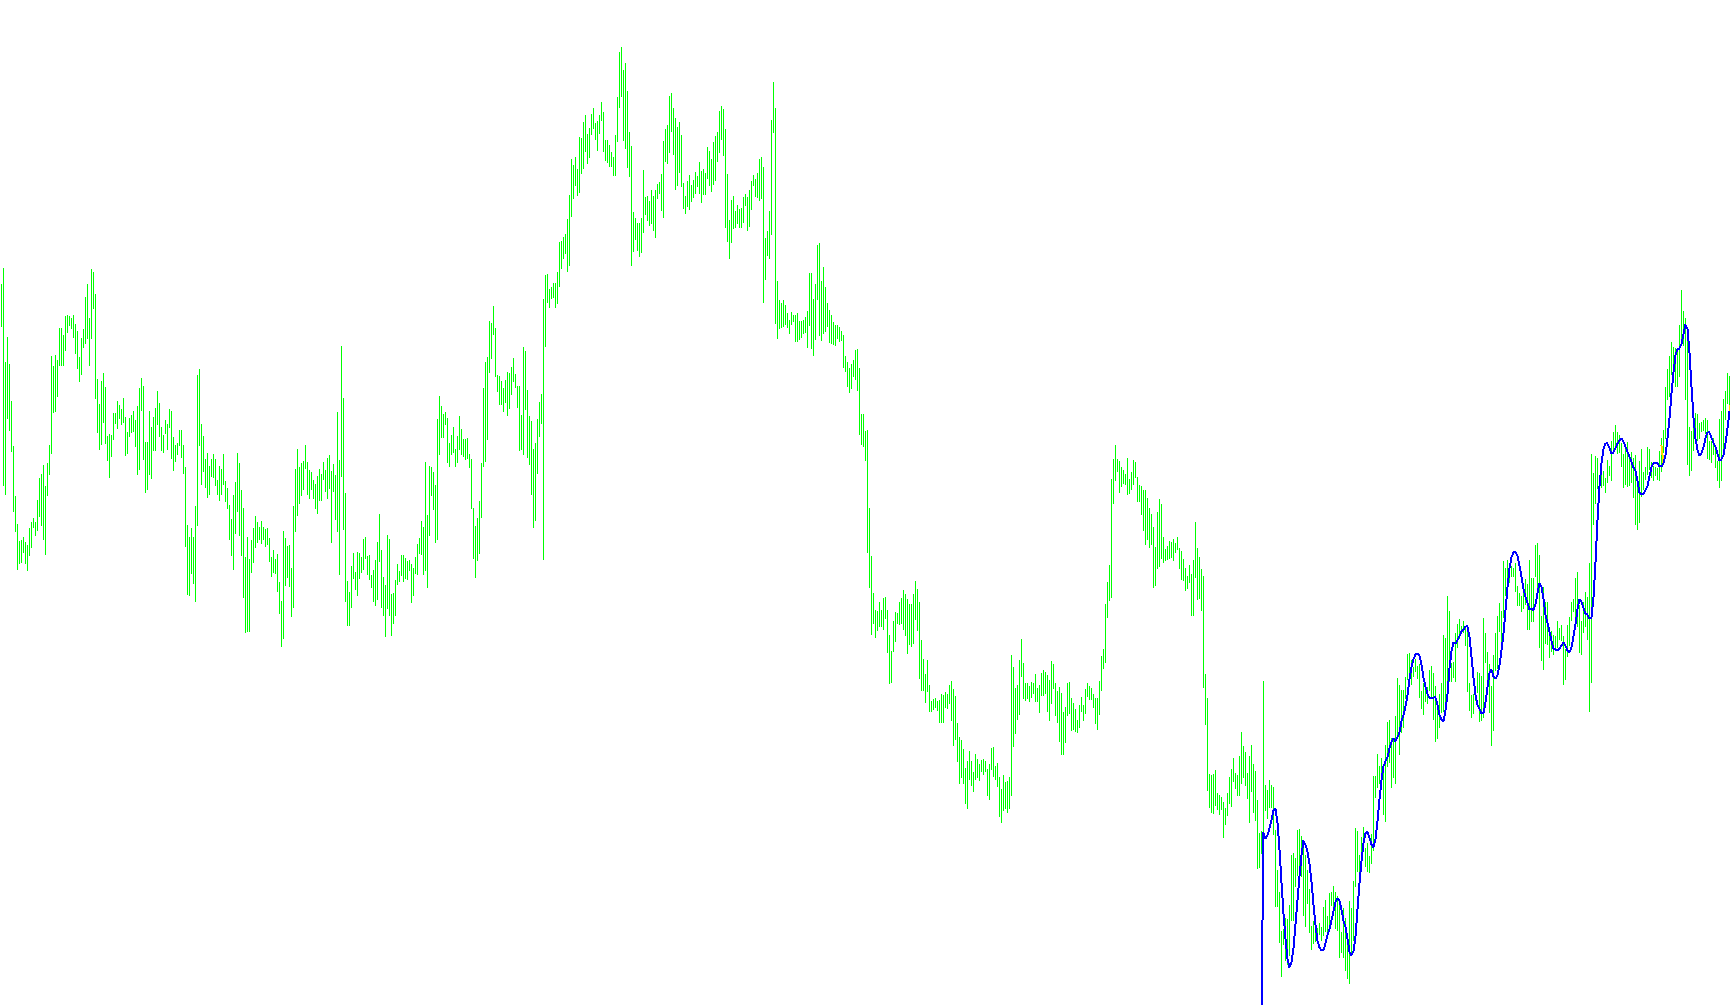
This tool is a visual financial analysis indicator designed to track price trends on a trading chart. Its primary purpose is to smooth out market "noise"—the small, erratic price fluctuations—to help traders identify the underlying direction of the market more clearly.
Core Logic and Methodology
The script functions by calculating a specialized type of moving average known as a Hull Moving Average (HMA). Unlike standard moving averages that can be sluggish or lag behind current prices, this logic uses a multi-step mathematical process to stay responsive while remaining smooth.
1. Data Weighted Processing The tool begins by looking at the "Open" prices of candles over a user-defined period. It performs two distinct calculations simultaneously:
- It calculates a moving average for a full designated period.
- It calculates a second moving average for exactly half of that period.
By doubling the shorter-period average and subtracting the longer-period average, the script creates a highly reactive intermediate value. This specific formula is designed to reduce the delay typically found in traditional technical indicators.
2. Smoothing the Curve To prevent the indicator from becoming too erratic or "jittery," the script takes that intermediate value and applies a final smoothing pass based on the square root of the original period. This ensures that the resulting line flows naturally across the chart, making it easier for the human eye to follow the trend.
3. Dynamic Trend Coloration The visual output of this script is unique because it changes color based on the momentum of the price:
- Trend Detection: The logic constantly compares the current value of the moving average against its previous position.
- Color Switching: If the current value is higher than the previous one (indicating upward momentum), the indicator renders in White. If the value is lower (indicating downward momentum), it switches to Red.
Summary for Traders
Essentially, this script acts as a "trend filter." Instead of looking at raw price bars, traders use this indicator to see a smoothed path of where the price has been. When the line turns White and moves upward, it signals bullish momentum; when it turns Red and curves downward, it signals bearish momentum. It is designed to provide a clear, real-time visual cue of market direction while minimizing the "lag" that often confuses less experienced traders.
//-----------------------
// HMA modified by Ron
//-----------------------

#property link      "http://www.justdata.com.au/Journals/AlanHull/hull_ma.htm"

#property indicator_chart_window
#property indicator_buffers 2
#property indicator_color1 White
#property indicator_color2 Red


//---- External parameters
extern int _maPeriod=14;
extern int NumBars = 200;


//---- indicator buffers
double _hmaW[];
double _hmaR[];
double _wma[];


int init()
  {
   // 233 up arrow
   // 234 down arrow
   // 159 big dot
   // 158 little dot
   // 168 open square
   // 120 box with X

	//---- indicator buffers memory
	IndicatorBuffers(3);

	//---- indicator buffers mapping
	SetIndexBuffer(0, _hmaW);
   SetIndexStyle(0, DRAW_LINE, STYLE_SOLID,2);
   //SetIndexArrow(0,159);

	SetIndexBuffer(1, _hmaR);
   SetIndexStyle(1, DRAW_LINE, STYLE_SOLID,2);
   //SetIndexArrow(1,159);

	SetIndexBuffer(2, _wma);
  }


int deinit()
  {
  }


int start()
  {
   int pos;

	int fullPeriod =                    _maPeriod;
	int halfPeriod =                    _maPeriod/2;
	int sqrtPeriod = MathFloor(MathSqrt(_maPeriod*1.00));

   double fullMA;
   double halfMA;


   double pastMA;
   double prevMA;
   double currMA;

   /*
   MetaStock Formula
   period:=Input("Period",1,200,20) ;
   sqrtperiod:=Input("Square Root of Period",1,20,4);
   Mov(2*(Mov(C,period/2,W))-Mov(C,period,W),sqrtperiod,W);

   SuperCharts Formula
   Input: period (Default value 20)
   waverage(2*waverage(close,period/2)-waverage(close,period), SquareRoot(Period))
   */

   for(pos=NumBars; pos>=0; pos--)
     {
      fullMA=iMA(Symbol(), 0, fullPeriod, 0, MODE_LWMA, PRICE_OPEN, pos);
      halfMA=iMA(Symbol(), 0, halfPeriod, 0, MODE_LWMA, PRICE_OPEN, pos);
      _wma[pos]=(2*halfMA)-fullMA;
     }
   for(pos=NumBars; pos>=0; pos--)
     {
      prevMA=iMAOnArray(_wma,0,sqrtPeriod,0,MODE_LWMA,pos+2);
      prevMA=iMAOnArray(_wma,0,sqrtPeriod,0,MODE_LWMA,pos+1);
      currMA=iMAOnArray(_wma,0,sqrtPeriod,0,MODE_LWMA,pos);
      if(prevMA<currMA)
        {
         _hmaW[pos]=currMA;
        }
       else
        {
         _hmaR[pos]=currMA;
        }

      if(pastMA>prevMA<currMA)
        {
         _hmaR[pos+1]=prevMA;
        }
      if(pastMA<prevMA>currMA)
        {
         _hmaW[pos+1]=prevMA;
        }


     }

  }
Comments