HMA_v04_v1
Download script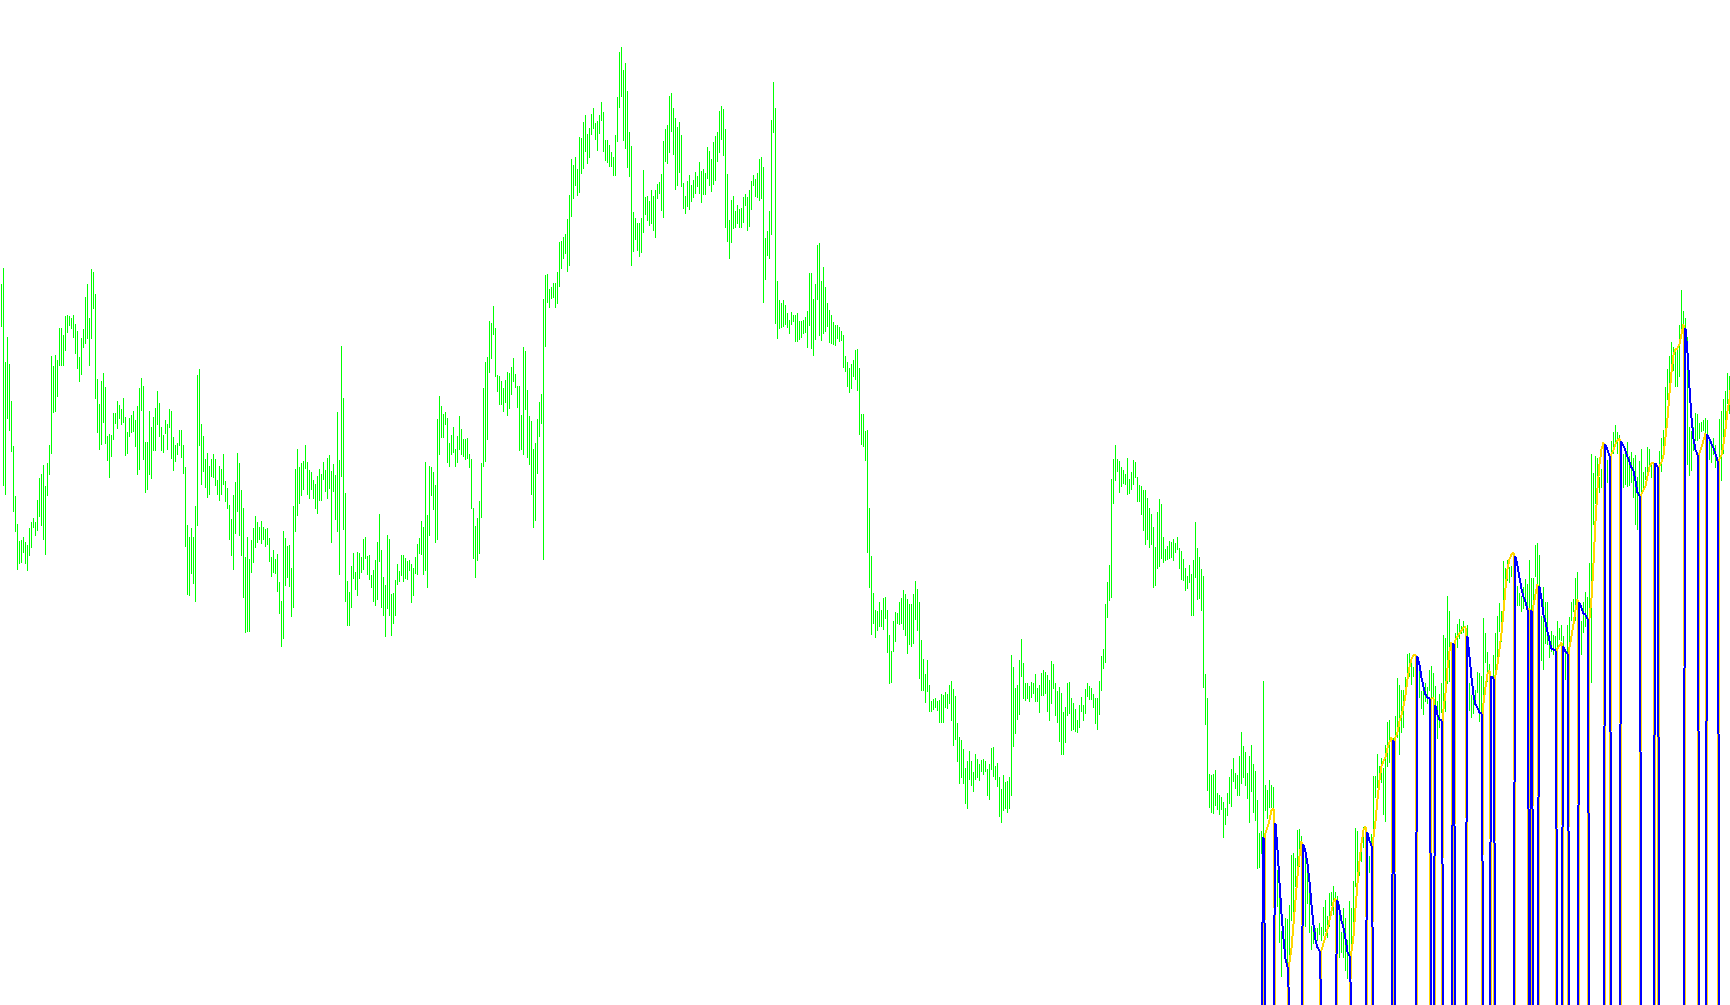
This tool is designed to provide traders with a smoothed visual representation of price action, specifically utilizing a modified version of the Hull Moving Average. Its primary objective is to identify the current direction of the market trend while filtering out the "noise" or minor fluctuations that often occur in volatile trading environments.
How it Works
The script processes market data through a multi-layered calculation to achieve a balance between speed and smoothness:
- Weighted Calculations: Instead of looking at simple averages, the logic uses Weighted Moving Averages. This gives more importance to recent price data, allowing the indicator to react more quickly to new price movements than a standard moving average would.
- The Core Formula: The tool calculates two different averages—one based on a full period and another based on half of that period. By doubling the half-period average and subtracting the full-period average, it creates a high-speed response signal that captures immediate momentum.
- Smoothing Layer: To prevent the indicator from being too erratic, the script then applies a final smoothing pass based on the square root of the original period. This ensures that while the indicator is fast enough to be useful for active trading, it remains steady enough to be reliable for long-term trend following.
Visual Interpretation
The script translates these complex mathematical movements into two distinct visual lines on your chart:
- Trend Direction (Green): When the smoothed value is rising, the indicator displays as a green line. This suggests upward momentum and is typically interpreted as a signal for bullish sentiment.
- Trend Reversal (Red): When the smoothed value begins to decline, the indicator switches to a red line. This signals downward momentum and is typically interpreted as a move toward bearish sentiment.
By using this logic, traders can clearly see where the "path of least resistance" lies, allowing for easier identification of trend changes without the lag often associated with traditional technical indicators.
/*-----------------------------+
|			       |
| Shared by www.Aptrafx.com    |
|			       |
+------------------------------*/

//-----------------------
// HMA modified by Ron
//-----------------------

#property link      "http://www.justdata.com.au/Journals/AlanHull/hull_ma.htm"

#property indicator_chart_window
#property indicator_buffers 2
#property indicator_color1 Green
#property indicator_color2 Red

//---- External parameters
extern int _maPeriod=14;
extern int BarsToDraw=200;

//---- indicator buffers
double _hmaG[];
double _hmaR[];
double _wma[];


int init()
  {
	//---- indicator buffers memory
	IndicatorBuffers(3);

	//---- indicator buffers mapping
	SetIndexBuffer(0, _hmaG);
   SetIndexEmptyValue(0, 0.0);
   SetIndexStyle(0, DRAW_LINE, STYLE_SOLID,2);

	SetIndexBuffer(1, _hmaR);
   SetIndexEmptyValue(1, 0.0);
   SetIndexStyle(1, DRAW_LINE, STYLE_SOLID,2);

	SetIndexBuffer(2, _wma);
  }


int deinit()
  {
  }


int start()
  {
   int pos;

	int     period = _maPeriod;
	int halfPeriod = _maPeriod/2;
	int sqrtPeriod = MathFloor(MathSqrt(period*1.00));

   double halfMA;
   double fullMA;

   double GorR;
   double prevGorR;

   /*
   MetaStock Formula
   period:=Input("Period",1,200,20) ;
   sqrtperiod:=Input("Square Root of Period",1,20,4);
   Mov(2*(Mov(C,period/2,W))-Mov(C,period,W),sqrtperiod,W);

   SuperCharts Formula
   Input: period (Default value 20)
   waverage(2*waverage(close,period/2)-waverage(close,period), SquareRoot(Period))
   */

   for(pos=BarsToDraw; pos>=0; pos--)
     {
      fullMA=iMA(Symbol(), 0,     period, 0, MODE_LWMA, PRICE_CLOSE, pos);
      halfMA=iMA(Symbol(), 0, halfPeriod, 0, MODE_LWMA, PRICE_CLOSE, pos);
      _wma[pos]=(2*halfMA)-fullMA;
     }

   for(pos=BarsToDraw; pos>=0; pos--)
     {
      prevGorR=GorR;
      GorR=iMAOnArray(_wma,0,sqrtPeriod,0,MODE_LWMA,pos);
      if (prevGorR<GorR)
        {
         _hmaG[pos]=GorR;
         _hmaR[pos]=EMPTY_VALUE;
        }
       else
        {
         _hmaG[pos]=EMPTY_VALUE;
         _hmaR[pos]=GorR;
        }
     }

  }
Comments