HMA_v07_v1
Download script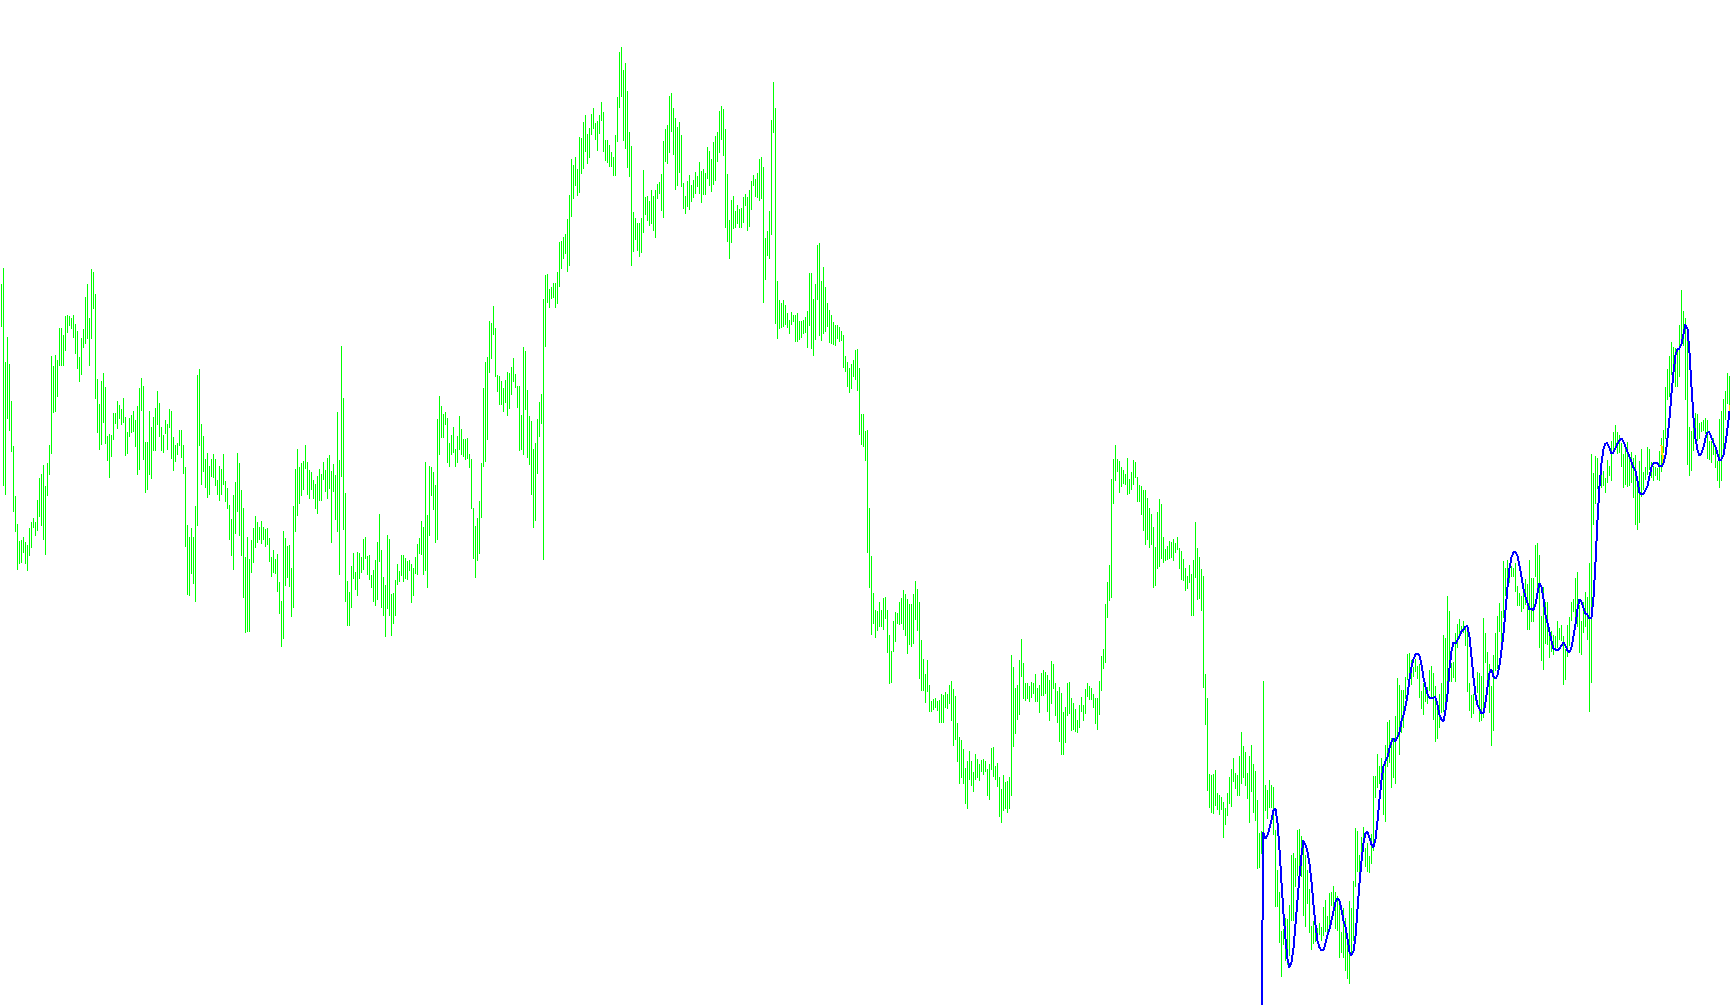
This custom indicator is designed to provide traders with a responsive and visually clear method for identifying price trends on a trading chart. It utilizes a specialized moving average logic known as the Hull Moving Average (HMA), which aims to balance two often-conflicting goals in technical analysis: reducing the "lag" (delay) of the signal while still maintaining a smooth, readable line.
Core Logic and Methodology
The script processes market data through a multi-layered calculation to distill out the current momentum of the price. Here is how that logic flows:
1. Data Smoothing and Weighting Instead of looking at raw price action alone, the script first calculates two different weighted moving averages based on the user-defined period. It takes a "short-term" average (half of the total period) and a "long-term" average (the full period). By doubling the short-term value and subtracting the long-term value, the script creates a high-sensitivity baseline that reacts quickly to sudden price shifts.
2. Stability through Square Root Scaling To ensure the data doesn't become too erratic or "noisy," the script applies a third layer of calculation using a square root calculation of the period. This acts as a final smoothing pass, ensuring that the resulting line flows naturally across the chart without creating false signals from minor price fluctuations.
3. Dynamic Trend Identification (Color Coding) The most distinct feature of this script is its ability to change direction visually. The logic constantly compares the current value of the smoothed average against the previous value:
- Upward Momentum: When the current value is higher than the previous one, the indicator identifies an upward trend and plots it using a specific color (White).
- Downward Momentum: When the current value is lower than the previous one, it identifies a downward trend and plots it using another color (Red).
User Experience and Purpose
For a trader, this means the tool acts as a real-time "trend follower." Rather than looking at a single line that might move back and forth confusingly, the script provides a clear visual distinction between bullish and bearish movements. It is designed to help users identify the prevailing direction of the market quickly, allowing for easier decision-making on whether to align with the current flow or look for potential trend reversals.
/*-----------------------------+
|			       |
| Shared by www.Aptrafx.com    |
|			       |
+------------------------------*/

//-----------------------
// HMA modified by Ron
//-----------------------

#property link      "http://www.justdata.com.au/Journals/AlanHull/hull_ma.htm"

#property indicator_chart_window
#property indicator_buffers 2
#property indicator_color1 White
#property indicator_color2 Red


//---- External parameters
extern int _maPeriod=14;

//---- indicator buffers
double _hmaW[];
double _hmaR[];
double _wma[];


int init()
  {
   // 233 up arrow
   // 234 down arrow
   // 159 big dot
   // 158 little dot
   // 168 open square
   // 120 box with X

	//---- indicator buffers memory
	IndicatorBuffers(3);

	//---- indicator buffers mapping
	SetIndexBuffer(0, _hmaW);
   SetIndexStyle(0, DRAW_LINE, STYLE_SOLID,2);
   //SetIndexArrow(0,159);

	SetIndexBuffer(1, _hmaR);
   SetIndexStyle(1, DRAW_LINE, STYLE_SOLID,2);
   //SetIndexArrow(1,159);

	SetIndexBuffer(2, _wma);
  }


int deinit()
  {
  }


int start()
  {
   int pos;

	int fullPeriod =                    _maPeriod;
	int halfPeriod =                    _maPeriod/2;
	int sqrtPeriod = MathFloor(MathSqrt(_maPeriod*1.00));

   double fullMA;
   double halfMA;


   double pastMA;
   double prevMA;
   double currMA;

   /*
   MetaStock Formula
   period:=Input("Period",1,200,20) ;
   sqrtperiod:=Input("Square Root of Period",1,20,4);
   Mov(2*(Mov(C,period/2,W))-Mov(C,period,W),sqrtperiod,W);

   SuperCharts Formula
   Input: period (Default value 20)
   waverage(2*waverage(close,period/2)-waverage(close,period), SquareRoot(Period))
   */

   for(pos=200; pos>=0; pos--)
     {
      fullMA=iMA(Symbol(), 0, fullPeriod, 0, MODE_LWMA, PRICE_OPEN, pos);
      halfMA=iMA(Symbol(), 0, halfPeriod, 0, MODE_LWMA, PRICE_OPEN, pos);
      _wma[pos]=(2*halfMA)-fullMA;
     }
   for(pos=200; pos>=0; pos--)
     {
      prevMA=iMAOnArray(_wma,0,sqrtPeriod,0,MODE_LWMA,pos+2);
      prevMA=iMAOnArray(_wma,0,sqrtPeriod,0,MODE_LWMA,pos+1);
      currMA=iMAOnArray(_wma,0,sqrtPeriod,0,MODE_LWMA,pos);
      if(prevMA<currMA)
        {
         _hmaW[pos]=currMA;
        }
       else
        {
         _hmaR[pos]=currMA;
        }

      if(pastMA>prevMA<currMA)
        {
         _hmaR[pos+1]=prevMA;
        }
      if(pastMA<prevMA>currMA)
        {
         _hmaW[pos+1]=prevMA;
        }


     }

  }
Comments