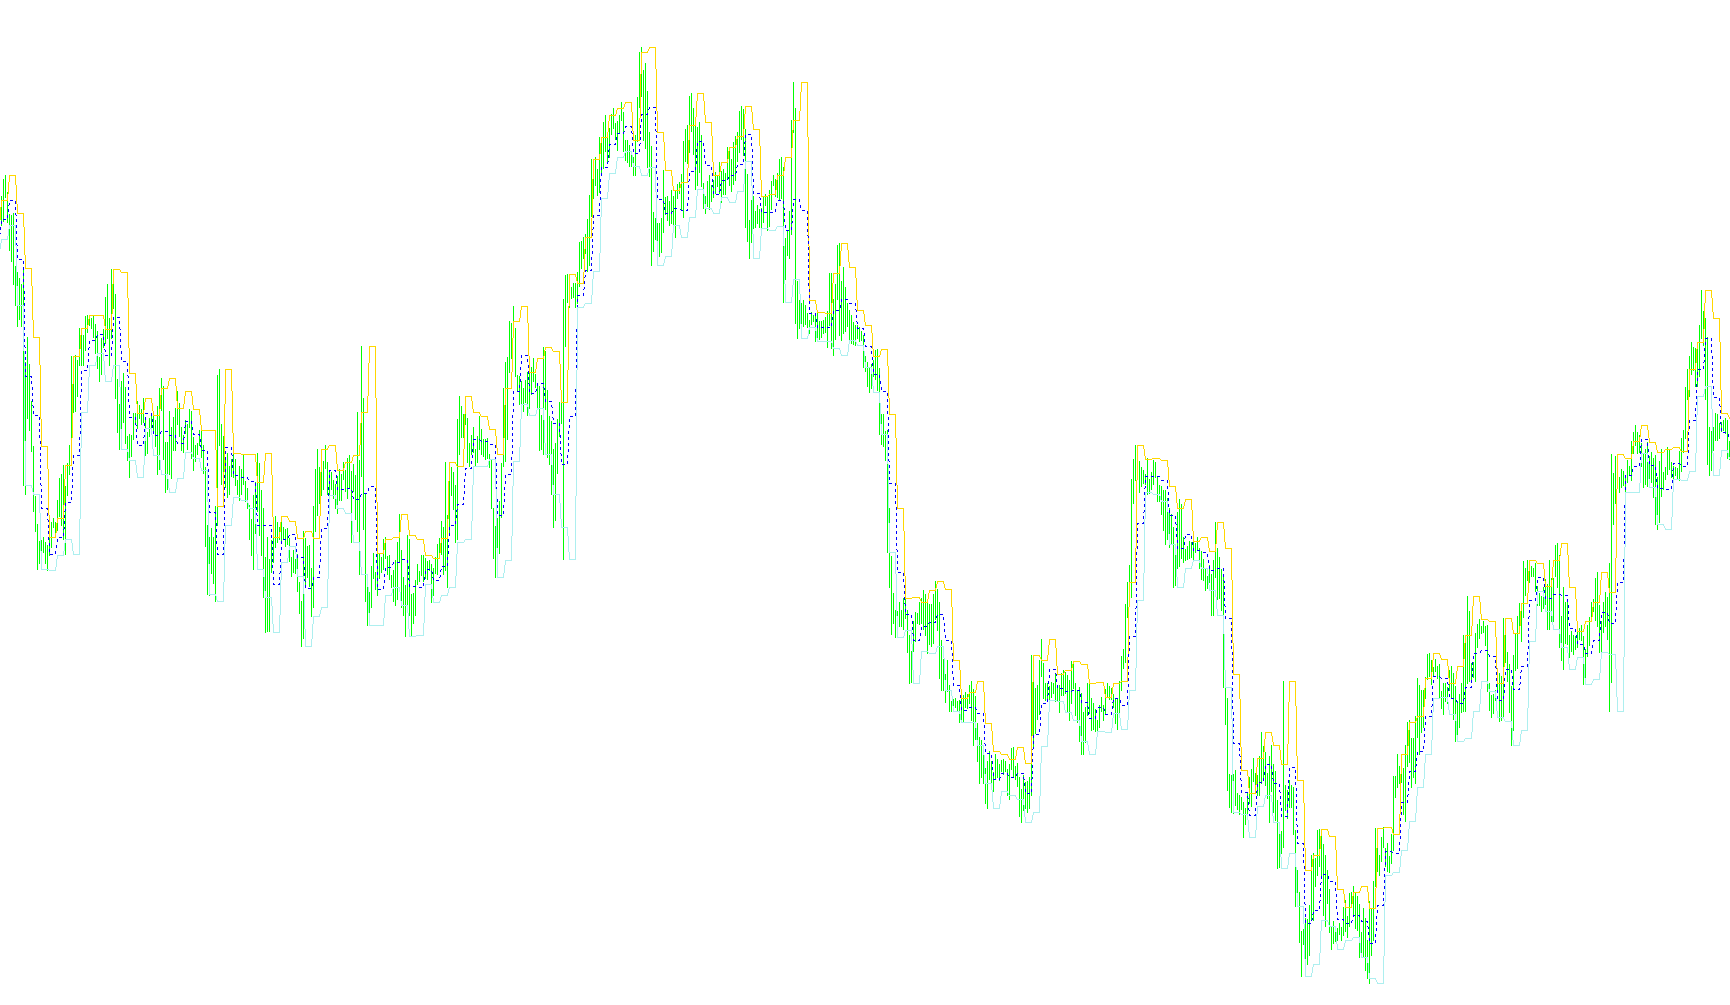
This tool is designed to help traders visualize specific price boundaries based on historical high and low points over a rolling time frame. By identifying these key levels, it allows for a clearer understanding of market structure and helps in identifying potential breakout opportunities.
Core Functionality
The primary purpose of this indicator is to automatically track and display the highest and lowest price points reached during a specific number of hours (which can be customized by the user). Instead of looking at just the most recent candle, it looks back at a defined block of time to establish "support" and "resistance" levels.
Key Components of the Logic:
- Dynamic High and Low Tracking: The script constantly monitors price action to identify the maximum (High) and minimum (Low) prices reached within your chosen timeframe. These are plotted on the chart as visual lines, making it easy to see where price has recently peaked or bottomed out.
- Customizable Lookback Period: Users have the flexibility to define the "window" of time they want to analyze. While it defaults to a 4-hour window, this can be adjusted to suit different trading styles, such as focusing on 1-hour trends or larger multi-hour movements.
- Median (Average) Line: In addition to the high and low boundaries, the tool calculates a middle "Median" line. This represents the midpoint between the highest and lowest prices of the period, providing a visual balance point for the current range.
- Real-Time Data Overlay: As new price data comes in, the indicator updates these levels dynamically. It ensures that the lines reflect the most accurate boundaries based on the historical data of the selected interval.
- On-Screen Statistics: To provide more context at a glance, the script can display a text comment directly on your chart. This summary shows the current high price, the low price, and the total "Range" (the distance between the two) calculated in pips.
Summary for Traders
Essentially, this tool automates the tedious task of manually identifying historical highs and lows. It creates a visual "box" or range on your chart based on a specific hourly history, allowing you to see exactly where the market is contained and providing clear price targets for breakout trading strategies.
//+------------------------------------------------------------------------+
//| This indicator was originaly called the HiLoH4.mq4 created by Rob Judd
//| to show the last four hours' Hi and Lo on the chart. THANK YOU ROB !!
//|
//| Accrete hacked the code to ad the Median line and also the ability
//| to change the look back time to include a user variable in the pop up
//| dialog box for breakout trading on 1 hour or more boxes.
//| File can be found at Accrete.com in indicator section with kudos
//| mentioned to Rob for original code. Renamed : ATM_HiLoXTF.mq4 by Accrete
//+------------------------------------------------------------------------+


#property indicator_chart_window
#property indicator_buffers 3
#property indicator_color1 Blue
#property indicator_color2 Purple
#property indicator_color3 Red


//---- input parameters
extern int HL_Hours = 4; //4 = 4 hours
extern bool show_comment=true;
extern bool show_average=true;

//---- indicator buffers
double ExtMapBuffer1[];
double ExtMapBuffer2[];
double ExtMapBuffer3[];

int init()
{
   SetIndexBuffer(0, ExtMapBuffer1);
      SetIndexStyle(0,DRAW_LINE, 0,1);
   SetIndexBuffer(1, ExtMapBuffer2);
   SetIndexStyle(1, DRAW_LINE, 2,0);
   SetIndexBuffer(2, ExtMapBuffer3);
   SetIndexStyle(2, DRAW_LINE, 0,1);
   return(0);
}

int deinit()
{
   return(0);
}

int start()
{
   int count, cur_hour, prev_hour = 0;
   double hour_high, hour_low, H, L, A = 0;

   if (Period() >= PERIOD_D1)
      return(0);

   for (count=Bars;count>=0;count--) {

      cur_hour = TimeHour(Time[count]);

      if (prev_hour != cur_hour) {

         prev_hour = cur_hour;


if (!MathMod(cur_hour,HL_Hours)) {

            H = hour_high;
            A = (hour_high+hour_low)*0.5;
            L = hour_low;


            hour_high = High[count];
            hour_low = Low[count];
         }
      }

      hour_high = MathMax(hour_high, High[count]);
      hour_low = MathMin(hour_low, Low[count]);

      ExtMapBuffer1[count] = H;
      if (show_average)
         ExtMapBuffer2[count] = A;
      ExtMapBuffer3[count] = L;
   }

   if (show_comment)
            Comment("",HL_Hours, " Hour Hi=", H, ", Lo=", L, ", Range=", (H-L)/Point, " pips" );


   return(0);
}
Comments