HiLoBandsBug_v1
Download script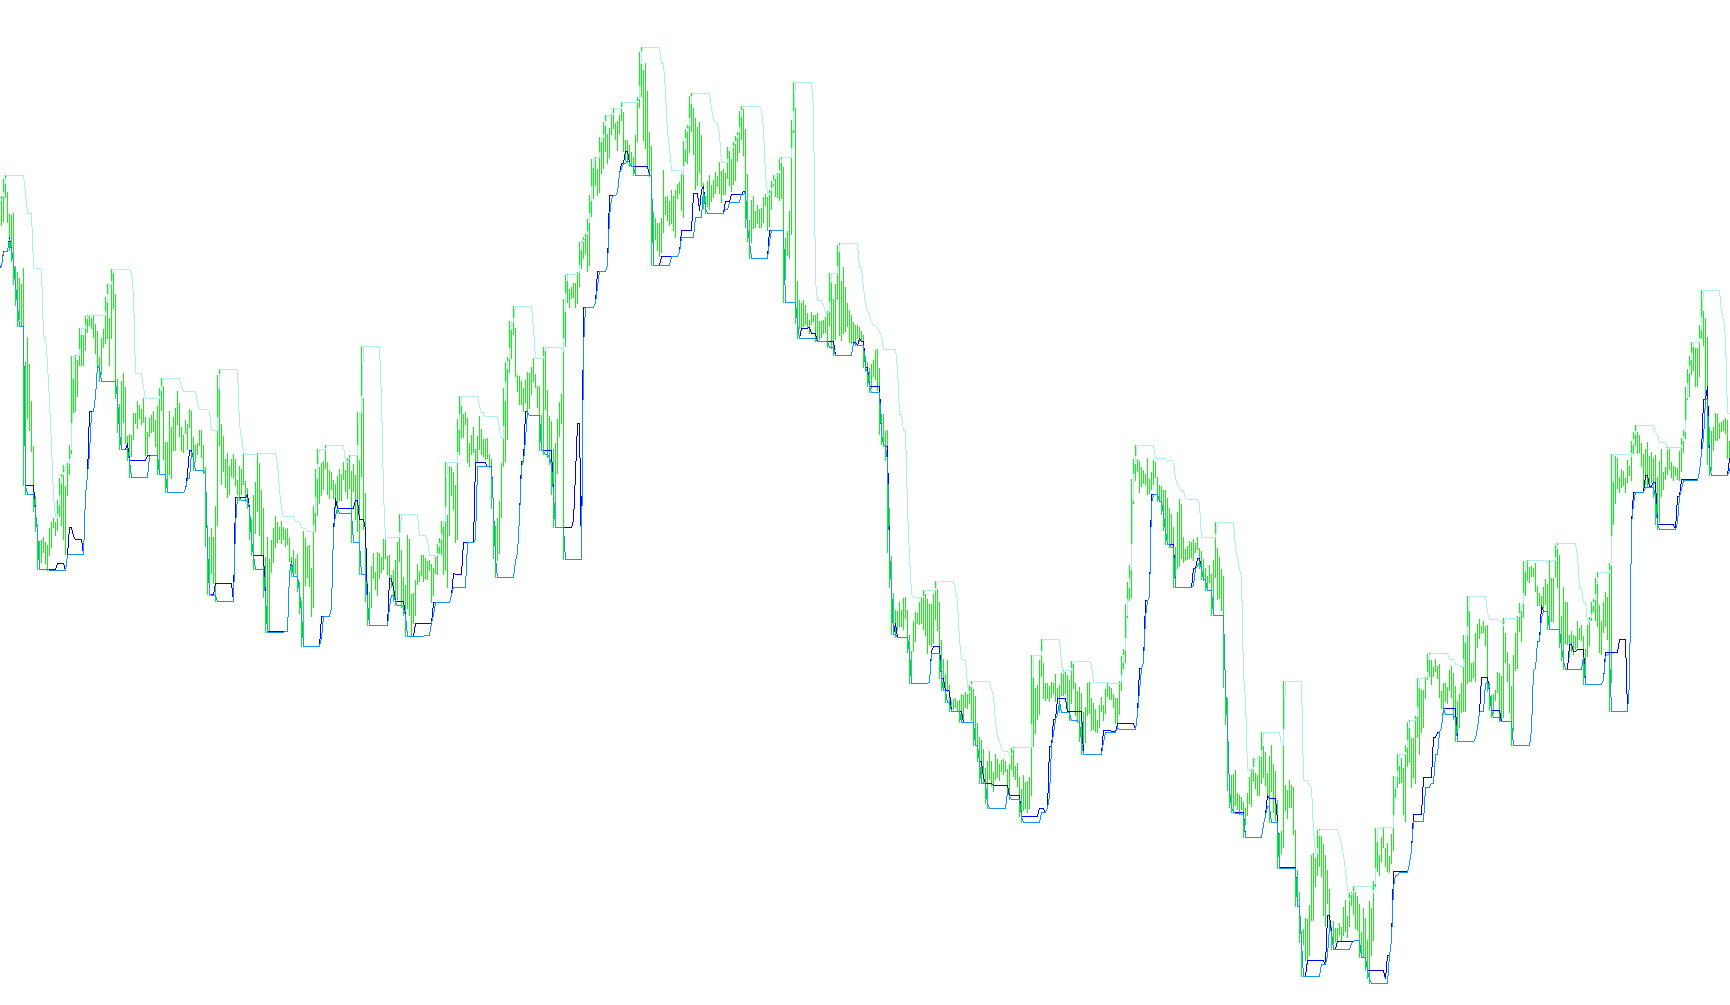
This tool is designed to identify and visualize price extremes—specifically the highest highs and lowest lows—over a moving window of time on a trading chart. Its primary purpose is to help traders see the boundaries of recent market activity by tracking price "peaks" and "valleys."
Core Mechanics
The logic operates by scanning a specific number of historical bars (customizable by the user) and calculating two distinct sets of price boundaries:
1. Primary Boundary Tracking The script identifies the highest and lowest prices within a set look-back period (defined as the "band length"). It focuses on capturing the absolute extremes reached during that timeframe to establish a baseline for current market volatility.
2. Comparative Manual Calculation In addition to the standard calculation, the script performs a secondary, manual check of the price data. By iterating through every individual bar in the look-back period one by one, it compares each price point against its neighbors. This ensures that the "High" and "Low" lines accurately reflect the maximum and minimum reach of the market price, providing a redundant verification of the boundaries.
Visual Output
The logic processes these calculations to generate four distinct visual components on the chart:
- Upper High Lines: Two different representations of the ceiling of recent price action.
- Lower Low Lines: Two different representations of the floor of recent price action.
Summary for Traders
Essentially, this script acts as a "boundary tracker." It looks back at a set amount of time (for example, the last 9 bars) and draws lines on your chart showing you exactly where the highest high and the lowest low occurred during that window. This allows traders to see the immediate trading range and identify whether the current price is approaching, breaking out of, or staying within recent established limits.
/*-----------------------------+
|			       |
| Shared by www.Aptrafx.com    |
|			       |
+------------------------------*/

//+------------------------------------------------------------------+
//|
//|
//+------------------------------------------------------------------+
#property copyright "HiLoBands"
#property link      ""

#property indicator_chart_window
#property indicator_buffers 5

#property indicator_color1 White
#property indicator_color2 Aqua
#property indicator_color3 Aqua
#property indicator_color4 Orange
#property indicator_color5 Orange

// THIS SHOWS A BUG WITH THE LOWER BANDS ON MY METATRADER


extern int CountBars=4000;

extern int bandlen=9;
int counter=0;
//---- buffers


double highline[],lowline[];
double highline2[],lowline2[];

//+------------------------------------------------------------------+
//| Custom indicator initialization function                         |
//+------------------------------------------------------------------+
int init()
  {
   string short_name;
//---- indicator line
   IndicatorBuffers(4);
   SetIndexStyle(0,DRAW_LINE);
   SetIndexStyle(1,DRAW_LINE);
   SetIndexBuffer(0,highline);
   SetIndexBuffer(1,lowline);
   SetIndexStyle(2,DRAW_LINE);
   SetIndexStyle(3,DRAW_LINE);
   SetIndexBuffer(2,highline2);
   SetIndexBuffer(3,lowline2);
//----
   return(0);
  }


//+------------------------------------------------------------------+
//| SilverTrend_PowerLaw                                             |
//+------------------------------------------------------------------+
int start()
  {
   CountBars = MathMin(Bars-bandlen-1,CountBars);

   int i,shift,counted_bars=IndicatorCounted();
   int i1,i2;
   int limit;
//----

//----
   if (counted_bars<0) return(-1);
   if (counted_bars>0) counted_bars--;


   limit = CountBars; // -counted_bars;
   if (limit < 1) limit = 1;
   ArrayResize(highline,limit);
   ArrayResize(lowline,limit);

   for (shift = limit; shift>=0; shift--)
   {
      double center, highweighted, lowweighted,range;

      // collect running highs and lows back in time.
      // high[k] means the highest high in the previous 'k' timesteps,
      // starting at shift.  Therefore high[k] must be monotonically increasing
      // as low[k] is monotonically decreasing.
      //
      int offset = 1;
      // for offset = 1 start computing using previous bar's data only, this may be
      // needed for causality if using a trading system
      double H1,L1;
      double H2,L2;

      H1 = High[Highest(Symbol(),0,PRICE_HIGH,bandlen,shift+offset)];
      L1 = Low[Lowest(Symbol(),0,PRICE_LOW,bandlen,shift+offset)];
      highline[shift] = H1;
      lowline[shift] = L1;
      // now do it manually
      H2 = High[shift+offset];
      L2 = Low[shift+offset];
      for (int k=1; k < bandlen; k++) {
         double HV = High[shift+k+offset];
         if (HV > H2) H2 = HV;
         //L2 = MathMin(L2,iLow(Symbol(),0,shift+k+offset));
         double LV = Low[shift+k+offset];
         if (LV < L2) L2 = LV;
      }
      highline2[shift] = H2;
      lowline2[shift] = L2;
    }

    //for (shift = limit; shift >= 0; shift--) {
 //     if (shift < CountBars-SmoothingLength-1) {
 //        smoothed[shift] = iMAOnArray(centerline,0,SmoothingLength,ma_shift,MODE_SMA,shift);
//         smoothedhigh[shift] = smoothed[shift] + range/2*WidthPCT/100;
//         smoothedlow[shift] = smoothed[shift]- range/2*WidthPCT/100;
//
//      } else
//         smoothed[shift] = 0.0;
//
//   }
   return(0);
}
//+------------------------------------------------------------------+
Comments