High_Low v2 (ZigZag)1_v1
Download script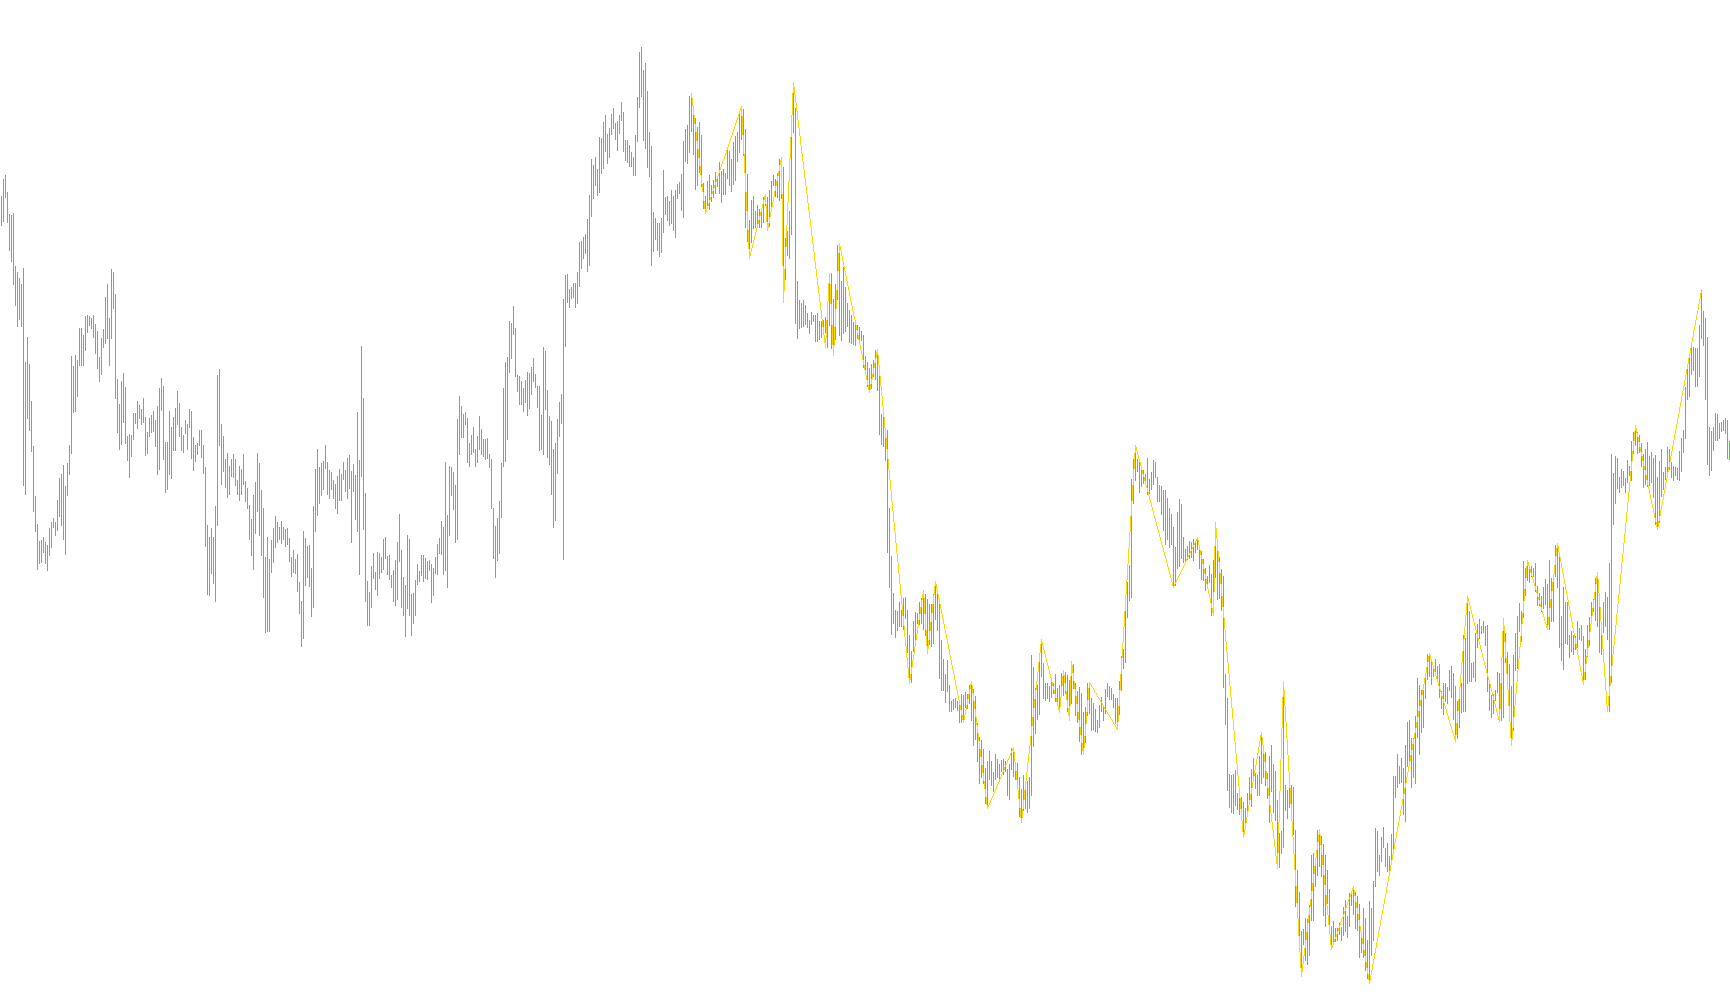
This tool is designed to analyze market price action by identifying and visualizing significant turning points, such as peaks (highs) and troughs (lows), on a trading chart. It essentially acts as a filter to separate "market noise" from meaningful structural moves.
How the Logic Works
The script processes historical price data using a multi-layered approach to determine what constitutes a true high or low:
1. Neighborhood Analysis Instead of looking at every single price tick, the script examines small clusters of candles (defined by the "Length" parameter). By comparing a candle to its immediate neighbors, it identifies whether a specific point is higher or lower than the prices surrounding it. This helps the tool ignore minor fluctuations and focus on significant shifts.
2. Identifying Trend Transitions The logic continuously tracks the current momentum of the price. It looks for specific conditions where:
- A price reaches a new local maximum (an upward "swing").
- A price drops to a new local minimum (a downward "swing").
- A price manages to exceed both its previous highs and lows simultaneously, which the script treats as a unique structural pivot point.
3. Peak and Trough Mapping Once the tool detects a shift in momentum—such as moving from an uptrend to a downtrend—it "locks in" the highest high or the lowest low of that specific movement. It stores these coordinates (the exact time and price) in a memory bank.
4. Visual Output Finally, the script takes all those identified pivot points and draws them onto your chart as a continuous line. This provides a visual representation of the "skeleton" of the market trend, allowing you to see the core structure of price movement without the clutter of every individual price tick.
Key Objectives
- Structure Recognition: To provide a clear view of the primary peaks and valleys in the market.
- Noise Reduction: To filter out minor price movements so traders can focus on larger structural changes.
- Historical Mapping: To automatically trace back through a large amount of historical data (defined by the "barn" parameter) to establish the current market context.
/*-----------------------------+
|			       |
| Shared by www.Aptrafx.com    |
|			       |
+------------------------------*/

//+------------------------------------------------------------------+
//|                                         High_Low v2 (ZigZag).mq4 |
//|
//|                                 Conversion only                    |
//+------------------------------------------------------------------+
#property copyright ""
#property link      ""

#property indicator_chart_window
#property indicator_buffers 1
#property indicator_color1 Red
//---- input parameters
extern int       barn=500;
extern int       Length=6;
//---- buffers
double ExtMapBuffer1[];

//+------------------------------------------------------------------+
//| Custom indicator initialization function                         |
//+------------------------------------------------------------------+
int init()
  {
//---- indicators
   SetIndexEmptyValue(0,0.0);
  //SetIndexDrawBegin(0, barn);
   SetIndexStyle(0,DRAW_SECTION);
   SetIndexBuffer(0,ExtMapBuffer1);

//----
   return(0);
  }
//+------------------------------------------------------------------+
//| Custor indicator deinitialization function                       |
//+------------------------------------------------------------------+
int deinit()
  {

   return(0);
  }
//+------------------------------------------------------------------+
//| Custom indicator iteration function                              |
//+------------------------------------------------------------------+
int start()
  {
   int    counted_bars=IndicatorCounted();
   int shift,Swing,Swing_n,uzl,i,zu,zd,mv;
   double LL,HH,BH,BL,NH,NL;
   double Uzel[10000][3];
   string text;
// loop from first bar to current bar (with shift=0)
      Swing_n=0;Swing=0;uzl=0;
      BH =High[barn];BL=Low[barn];zu=barn;zd=barn;

for (shift=barn;shift>=0;shift--) {
      LL=10000000;HH=-100000000;
   for (i=shift+Length;i>=shift+1;i--) {
         if (Low[i]< LL) {LL=Low[i];}
         if (High[i]>HH) {HH=High[i];}
   }


   if (Low[shift]<LL && High[shift]>HH){
      Swing=2;
      if (Swing_n==1) {zu=shift+1;}
      if (Swing_n==-1) {zd=shift+1;}
   } else {
      if (Low[shift]<LL) {Swing=-1;}
      if (High[shift]>HH) {Swing=1;}
   }

   if (Swing!=Swing_n && Swing_n!=0) {
   if (Swing==2) {
      Swing=-Swing_n;BH = High[shift];BL = Low[shift];
   }
      uzl=uzl+1;
   if (Swing==1) {
      Uzel[uzl][1]=zd;
      Uzel[uzl][2]=BL;
   }
   if (Swing==-1) {
      Uzel[uzl][1]=zu;
      Uzel[uzl][2]=BH;
   }
      BH = High[shift];
      BL = Low[shift];
   }

   if (Swing==1) {
      if (High[shift]>=BH) {BH=High[shift];zu=shift;}}
      if (Swing==-1) {
          if (Low[shift]<=BL) {BL=Low[shift]; zd=shift;}}
      Swing_n=Swing;
   }
   for (i=1;i<=uzl;i++) {
      //text=DoubleToStr(Uzel[i][1],0);
      //text=;
         mv=StrToInteger(DoubleToStr(Uzel[i][1],0));
      ExtMapBuffer1[mv]=Uzel[i][2];
   }


   return(0);
  }
//+------------------------------------------------------------------+
Comments