10Min_01
Download script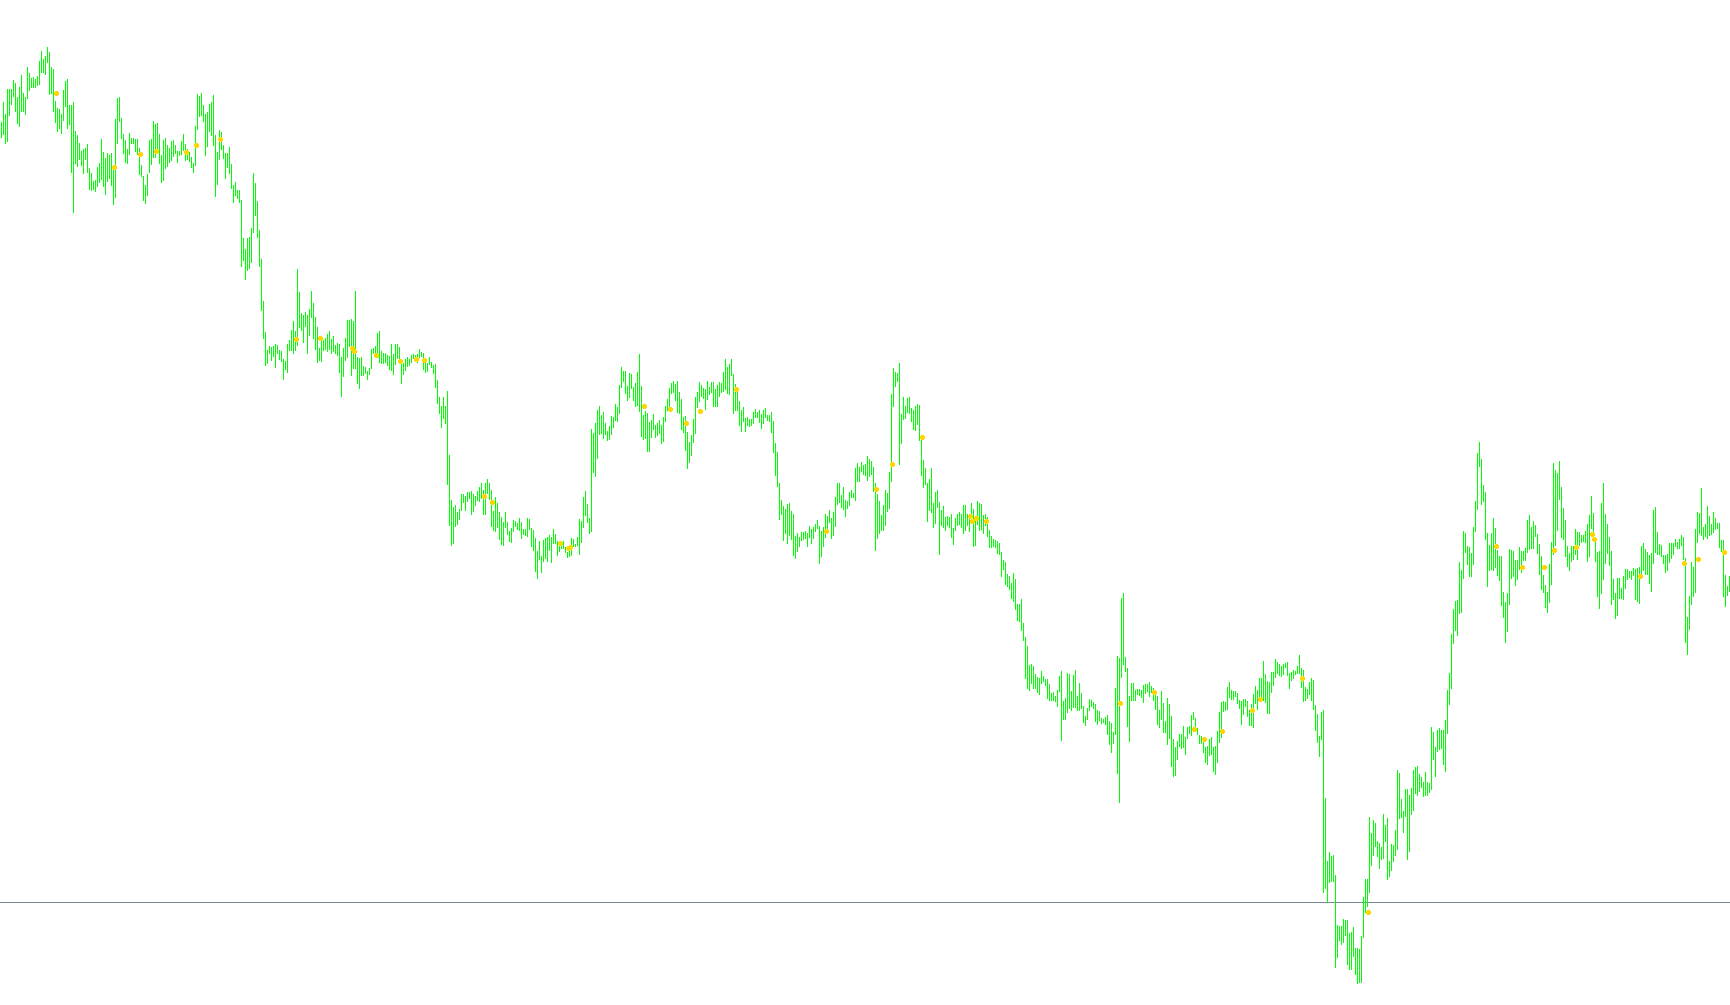
This script is designed as a visual trading tool for the MetaTrader platform, specifically engineered to identify potential market turning points by analyzing the relationship between different types of price averages.
How It Works
The core logic of this tool relies on comparing two different types of moving averages simultaneously: a Weighted Moving Average (WMA) and a Simple Moving Average (SMA).
While standard indicators often look at just one set of data, this script watches how these two averages interact with each other in real-time:
- The Weighted Moving Average: Gives more importance to recent price action.
- The Simple Moving Average: Provides a smoother, broader view of the price trend over a longer period.
Signal Generation
The tool identifies specific "crossover" moments. These occur when the faster, weighted average moves from being below the simple average to above it, or vice versa.
When these two lines cross each other, it suggests a potential shift in momentum—indicating that the short-term price trend is beginning to pull away from the long-term average. To make this easy for a trader to see at a glance, the script automatically places visual markers (squares) on the chart exactly at the point where these crossovers occur.
Technical Overview
Even though the script collects data from several other complex indicators (such as Stochastic oscillators, RSI, and MACD), it uses them as background calculations while focusing its primary visual output on the crossover of the moving averages. By highlighting these intersections, the tool aims to filter out "noise" and help a trader identify clear entry or exit zones based on trend transitions.
//+------------------------------------------------------------------+
//| 10 Minute trader                                                 |
//+------------------------------------------------------------------+
#property copyright "Ron T"
#property link      "http://www.lightpatch.com"

#property indicator_chart_window
#property indicator_buffers 4
#property indicator_color1 White
#property indicator_color2 Red
#property indicator_color3 Blue
#property indicator_color4 Green

//---- buffers
double ExtMapBuffer1[];
double ExtMapBuffer2[];
double ExtMapBuffer3[];
double ExtMapBuffer4[];


// User Input


//+------------------------------------------------------------------+
//| Custom indicator initialization function                         |
//|------------------------------------------------------------------|

int init()
  {

   // 233 up arrow
   // 234 down arrow
   // 159 open square

   SetIndexStyle(0,DRAW_ARROW);
   SetIndexBuffer(0, ExtMapBuffer1);
   SetIndexArrow(0,159);

   SetIndexStyle(1,DRAW_ARROW);
   SetIndexBuffer(1, ExtMapBuffer2);
   SetIndexArrow(1,159);

   SetIndexStyle(2,DRAW_ARROW);
   SetIndexBuffer(2, ExtMapBuffer3);
   SetIndexArrow(2,159);

   SetIndexStyle(3,DRAW_ARROW);
   SetIndexBuffer(3, ExtMapBuffer4);
   SetIndexArrow(3,159);

   return(0);
  }


//+------------------------------------------------------------------+
//| Custor indicator deinitialization function                       |
//+------------------------------------------------------------------+
int deinit()
  {
   int i;

   for( i=0; i<Bars; i++ ) ExtMapBuffer1[i]=0;
   for( i=0; i<Bars; i++ ) ExtMapBuffer2[i]=0;
   for( i=0; i<Bars; i++ ) ExtMapBuffer3[i]=0;
   for( i=0; i<Bars; i++ ) ExtMapBuffer4[i]=0;

   return(0);
  }


//+------------------------------------------------------------------+
//| Custom indicator iteration function                              |
//+------------------------------------------------------------------+
int start()
  {
   double    wma=0,    wma_p=0;  // linear Weighted Moving Average (and _Previous)
   double    sma=0,    sma_p=0;  // Simple Moving Average (and _Previous)
   double stochm=0;              // STOCHastic Main
   double stochs=0;              // STOCHastic Signal
   double  macdm=0;              // Moving Average Convergance Divergance Main
   double  macds=0;              // Moving Average Convergance Divergance Signal
   double    rsi=0;              // Relative Strength Indicator

   int pos=Bars-100;             // leave room for moving average periods

   while(pos>=0)
     {

      wma_p=wma; // save previous calculations
      wma=iMA(Symbol(),0,10,0,MODE_LWMA,PRICE_CLOSE,pos);

      sma_p=sma; // save previous calculations
      sma=iMA(Symbol(),0,20,0,MODE_SMA,PRICE_CLOSE,pos);

      // Cannot plot these since they are 0-100
      // and chart is likely autoranging to 1.2000
      stochm=iStochastic(Symbol(),0,10,6,6,0,1,0,pos);
      stochs=iStochastic(Symbol(),0,10,6,6,0,1,1,pos);

      rsi=iRSI(Symbol(),0,28,PRICE_CLOSE,pos);

      macdm=iMACD(Symbol(),0,24,52,18,0,0,pos);
      macds=iMACD(Symbol(),0,24,52,18,0,1,pos);

      if ( wma_p < sma_p && wma > sma )
        {
         ExtMapBuffer1[pos]=wma;
        }

      if ( wma_p > sma_p && wma < sma )
        {
         ExtMapBuffer1[pos]=wma;
        }

 	   pos--;
     }

   return(0);
  }
//+------------------------------------------------------------------+
Comments