Hull_O_H_L_C_001
Download script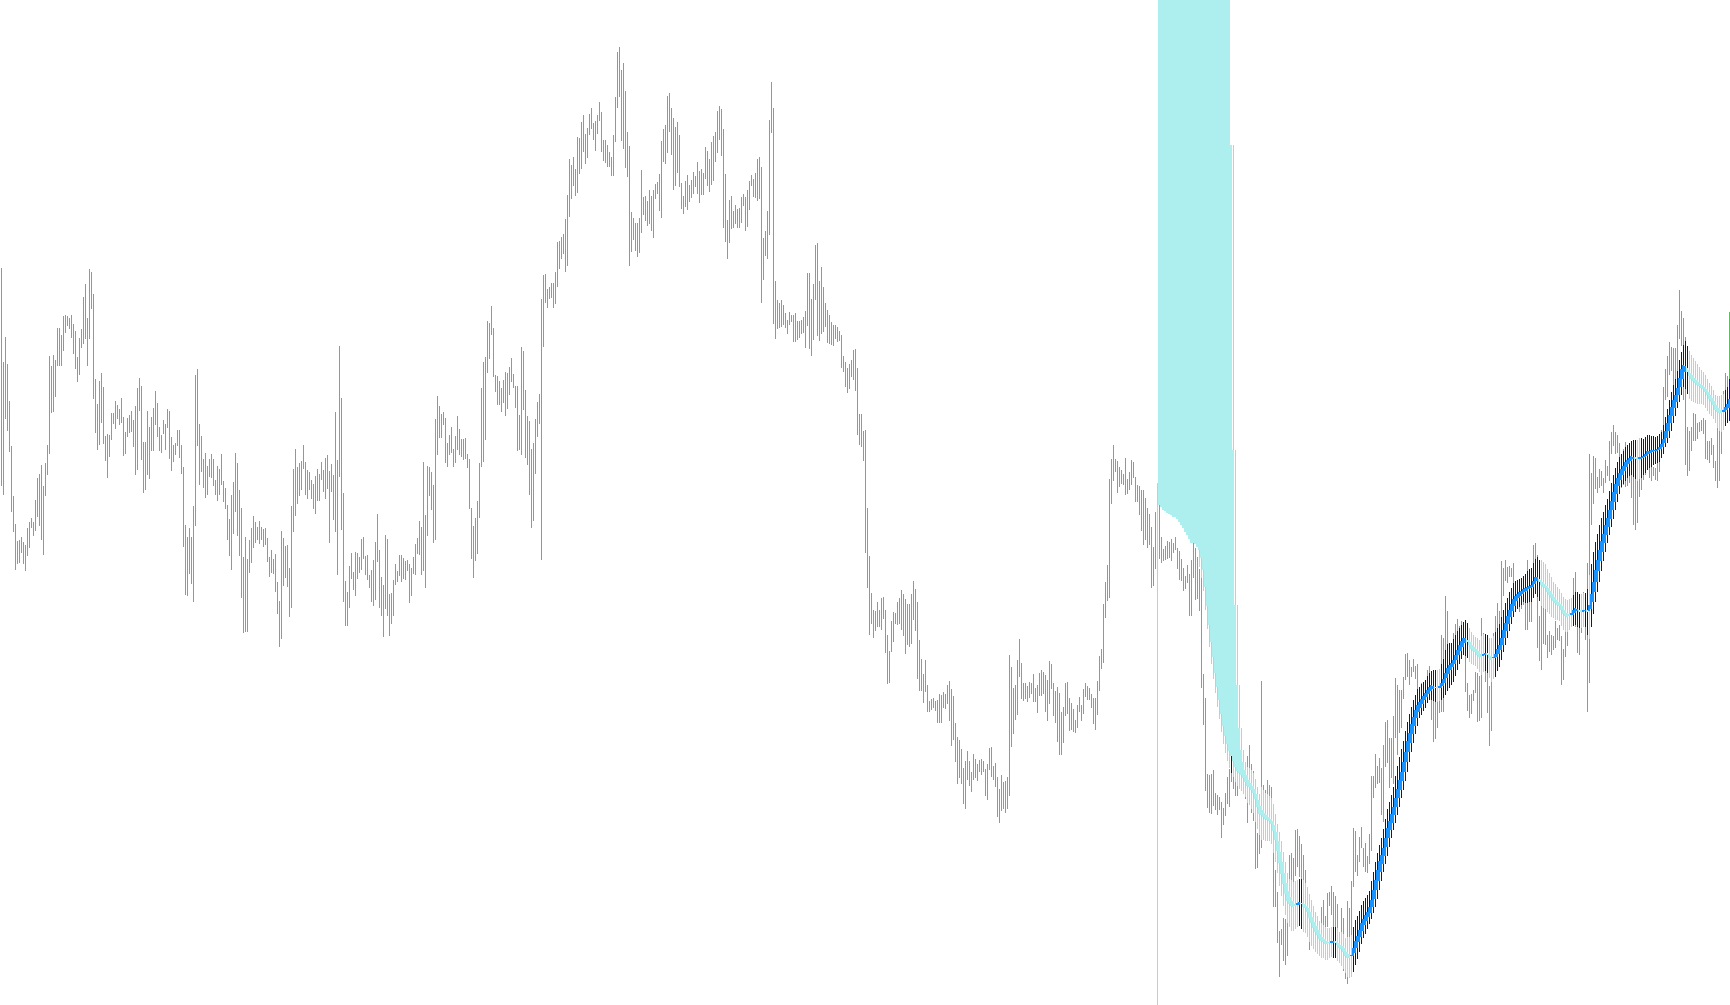
This technical tool is designed to analyze and visualize price movements on a trading chart by calculating specialized moving averages. Unlike standard indicators that only look at one type of price data (like just the closing price), this script processes multiple layers of market information—specifically opening prices, closing prices, highs, and lows—to create a more comprehensive view of market trends.
Core Logic Overview
The indicator functions by blending two distinct mathematical concepts: a weighted moving average calculation and a "Heikin Ashi" style smoothing logic. Here is how it processes that data step-by-step:
1. Multi-Point Data Gathering The script looks at four different price points for every candle on your chart: the High, Low, Open, and Close. It applies a moving average to each of these points individually, but it does so using two different timeframes simultaneously. By calculating a shorter timeframe and a longer timeframe and combining them mathematically, it creates a "smoothed" version of the market's current state.
2. Dynamic Trend Smoothing Instead of showing you raw, jagged price jumps, the script uses a recursive calculation. This means that every new data point calculated is influenced by the previous data point. This creates a fluid, continuous line rather than a series of disconnected dots. It effectively "filters out" market noise to help traders see the underlying direction of the price movement.
3. Visual Representation The script generates four distinct visual outputs (buffers) based on these calculations:
- It identifies the extremes (the highest and lowest points) of the smoothed data.
- Depending on whether the current trend is moving upward or downward, it assigns different values to different colors.
- This results in a visual representation that highlights the "body" and "range" of the price action, allowing you to see the strength of a move more clearly than you could by looking at standard price bars alone.
Summary for the User
In simple terms, this script takes the messy, volatile movements of the market and cleans them up. It calculates a "refined" average of the highs, lows, opens, and closes, then draws these as smooth lines on your chart. It is designed to help you identify the prevailing trend by stripping away minor price fluctuations and highlighting the core momentum of the market.
//+------------------------------------------------------------------+
//|                                                 Hull_O_H_L_C.mq4 |
//|                                           Copyright © 2007, None |
//|                                      Planet.Earth.Redistribution |
//+------------------------------------------------------------------+

#property copyright "Copyright © 2007, None"
#property link      "Planet.Earth.Redistribution"

#property indicator_chart_window

#property indicator_buffers 4

#property indicator_color1 Red
#property indicator_color2 Blue
#property indicator_color3 Red
#property indicator_color4 Blue

//---- parameters

extern int MaMethod   =  1;
extern int MaPeriod   = 60;
extern int DrawType   =  2;
extern int OpCl_Width =  2;
extern int ShowBars   = 250;

//---- buffers

double ExtMapBuffer1[];
double ExtMapBuffer2[];
double ExtMapBuffer3[];
double ExtMapBuffer4[];
double maOpen, maClose, maLow, maHigh;
double haOpen, haHigh, haLow, haClose;
//----

int ExtCountedBars=0;

//+------------------------------------------------------------------+
//| Custom indicator initialization function                         |
//|------------------------------------------------------------------|

int init()
  {
//---- indicators

   IndicatorBuffers(4);

   SetIndexBuffer(0,ExtMapBuffer1);
   SetIndexEmptyValue(0,EMPTY_VALUE);
   SetIndexDrawBegin(0,MaPeriod);
   SetIndexStyle(0,DrawType,STYLE_SOLID,1);
   SetIndexLabel(0," Mode 0 ");

   SetIndexBuffer(1,ExtMapBuffer2);
   SetIndexEmptyValue(1,EMPTY_VALUE);
   SetIndexDrawBegin(1,MaPeriod);
   SetIndexStyle(1,DrawType,STYLE_SOLID,1);
   SetIndexLabel(1," Mode 1 ");

   SetIndexBuffer(2,ExtMapBuffer3);
   SetIndexEmptyValue(2,EMPTY_VALUE);
   SetIndexDrawBegin(2,MaPeriod);
   SetIndexStyle(2,DrawType,STYLE_SOLID,OpCl_Width);
   SetIndexLabel(2," Mode 2 ");

   SetIndexBuffer(3,ExtMapBuffer4);
   SetIndexEmptyValue(3,EMPTY_VALUE);
   SetIndexDrawBegin(3,MaPeriod);
   SetIndexStyle(3,DrawType,STYLE_SOLID,OpCl_Width);
   SetIndexLabel(3," Mode 3 ");

//---- initialization done
   return(0);
  }

//+------------------------------------------------------------------+
//| Custor indicator deinitialization function                       |
//+------------------------------------------------------------------+

int deinit()
  {
//---- TODO: add your code here

//----
   return(0);
  }

//+------------------------------------------------------------------+
//| Custom indicator iteration function                              |
//+------------------------------------------------------------------+

int start()
  {


   if(Bars<=10) return(0);
   ExtCountedBars=IndicatorCounted();

//---- check for possible errors

   if (ExtCountedBars<0) return(-1);

//---- last counted bar will be recounted

   if (ExtCountedBars>0) ExtCountedBars--;

   //int pos=Bars-ExtCountedBars-2;

   int pos=ShowBars;

   if (pos >= (Bars-ExtCountedBars-2)) pos = Bars-ExtCountedBars-2;

   while(pos>=0)
     {

      maOpen =iMA(Symbol(),0,MathFloor(MaPeriod/2),0,MaMethod,PRICE_OPEN ,pos)*2-iMA(Symbol(),0,MaPeriod,0,MaMethod,PRICE_OPEN ,pos);
      maClose=iMA(Symbol(),0,MathFloor(MaPeriod/2),0,MaMethod,PRICE_CLOSE,pos)*2-iMA(Symbol(),0,MaPeriod,0,MaMethod,PRICE_CLOSE,pos);
      maLow  =iMA(Symbol(),0,MathFloor(MaPeriod/2),0,MaMethod,PRICE_LOW  ,pos)*2-iMA(Symbol(),0,MaPeriod,0,MaMethod,PRICE_LOW  ,pos);
      maHigh =iMA(Symbol(),0,MathFloor(MaPeriod/2),0,MaMethod,PRICE_HIGH ,pos)*2-iMA(Symbol(),0,MaPeriod,0,MaMethod,PRICE_HIGH ,pos);


      haHigh=MathMax(maHigh, MathMax(haOpen, haClose));
      haLow=MathMin(maLow, MathMin(haOpen, haClose));

      if (haOpen<haClose)
        {
         ExtMapBuffer1[pos]=haLow;
         ExtMapBuffer2[pos]=haHigh;
        }
      else
        {
         ExtMapBuffer1[pos]=haHigh;
         ExtMapBuffer2[pos]=haLow;
        }

      haOpen=(ExtMapBuffer3[pos+1]+ExtMapBuffer4[pos+1])/2;

      ExtMapBuffer3[pos]=haOpen;

      haClose=(maOpen+maHigh+maLow+maClose)/4;

      ExtMapBuffer4[pos]=haClose;

 	   pos--;
     }

//----
   return(0);
  }
//+------------------------------------------------------------------+
Comments