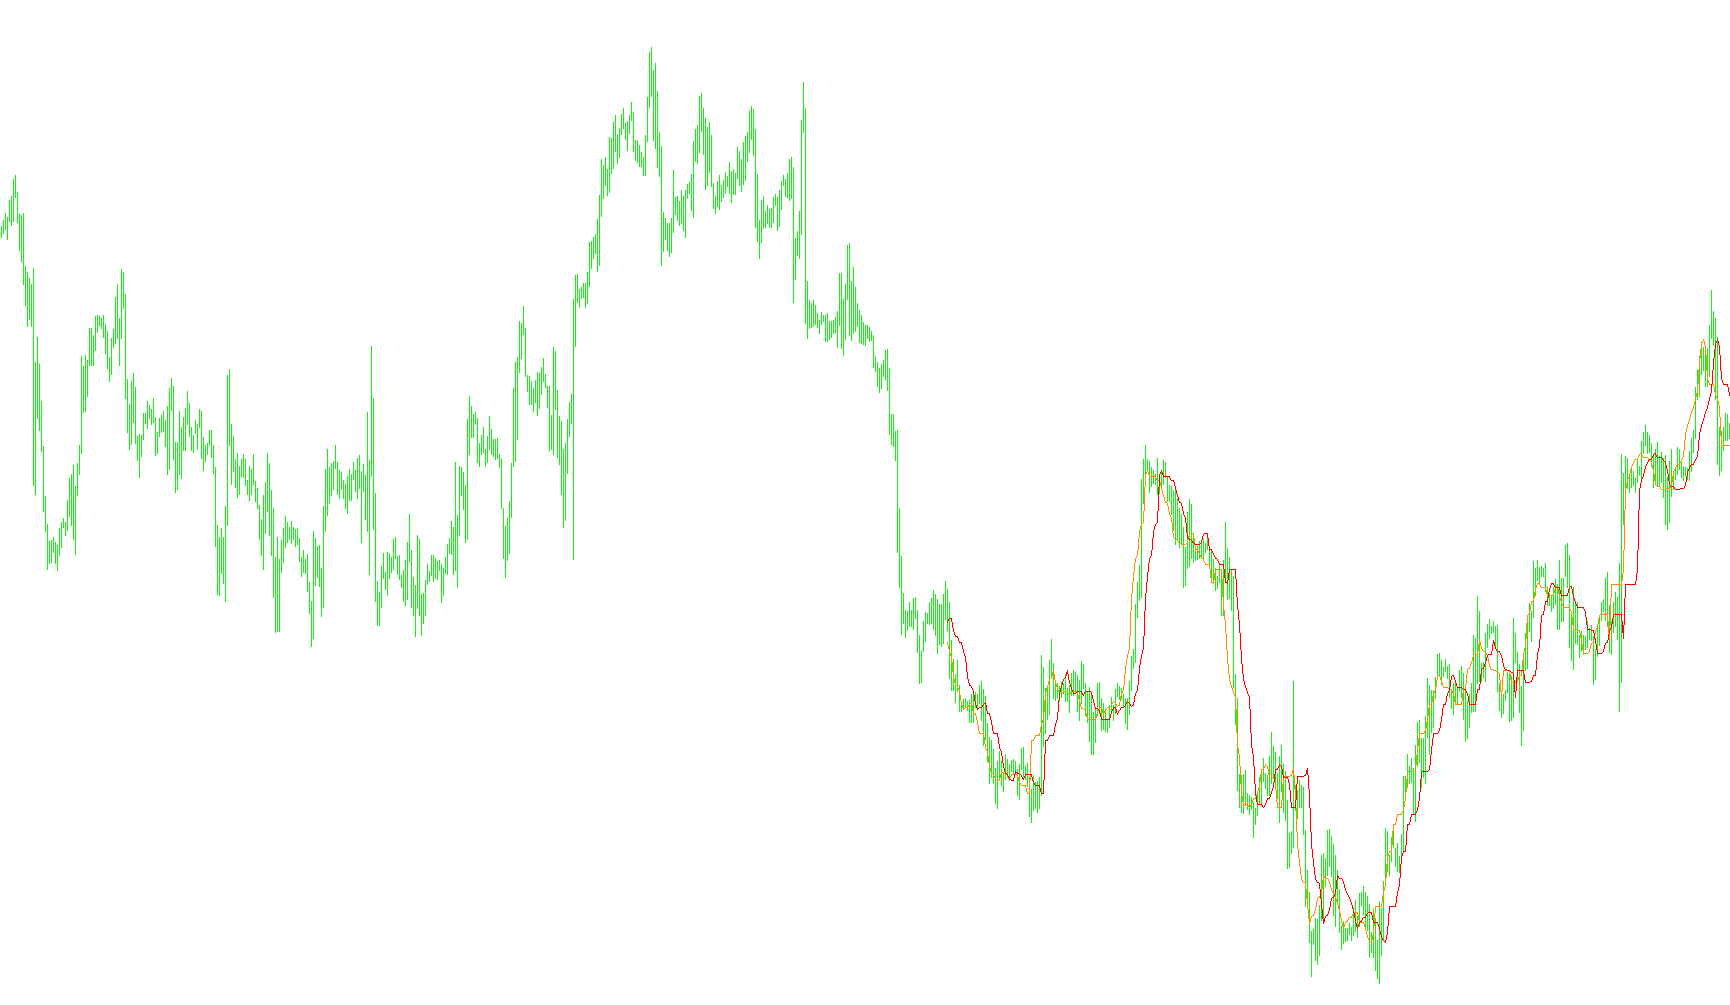
This tool is designed to analyze market trends by identifying specific price boundaries and notifying you when a shift in momentum occurs. Instead of tracking every small fluctuation, it focuses on the relationship between recent high and low price points to help traders identify potential entry signals.
How the Logic Works
1. Market Range Analysis The script continuously monitors a set window of recent historical bars (the "lookback" period). Within this window, it identifies the highest and lowest prices reached. By establishing these boundaries, the tool creates a mathematical "envelope" of the current market activity.
2. Dynamic Boundary Calculation Rather than using fixed price levels, the script calculates two specific thresholds based on a percentage of the current market range:
- Upper Threshold: A calculation based on a maximum percentage limit relative to the high/low range.
- Lower Threshold: A calculation based on a minimum percentage limit relative to the high/low range.
3. Signal Generation (The "Cross" Logic) The core intelligence of the script lies in comparing these two calculated values. It tracks how these thresholds move over time:
- Buy Signals: When the primary calculation value rises above the secondary threshold, it indicates a potential upward trend or "Buy" opportunity.
- Sell Signals: When the primary calculation value falls below the secondary threshold, it indicates a potential downward trend or "Sell" opportunity.
4. Alert System & Noise Filtering To ensure the tool is practical for active trading, it includes a smart notification system:
- Real-time Alerts: It can trigger both visual and audible alerts the moment a crossover occurs.
- Notification Logic: The script is programmed to prevent "alert fatigue." It ensures that you only receive one alert per trend change (e.g., it won't keep pinging you for every tick of a Buy signal; it waits until the trend shifts to a Sell before notifying you again).
- On-Screen Feedback: The script provides real-time text updates on your chart, showing the current status and the exact price level where the signal was triggered.
Summary for the Trader
Essentially, this script acts as a trend-following filter. It watches the "stretch" of the market to determine if the price is leaning towards a bullish or bearish direction. When the calculated momentum crosses these mathematical boundaries, it signals a potential shift in market sentiment, allowing you to react to new trends while filtering out minor price noise.
/*-----------------------------+
|			       |
| Shared by www.Aptrafx.com    |
|			       |
+------------------------------*/

//+------------------------------------------------------------------+
//| Filename changed to ForexOFFTrend.mq4 by CrazyChart              |
//|                                                 SilverTrend .mq4 |
//|                             SilverTrend  rewritten by CrazyChart |
//|                                                 http://viac.ru/  |
//+------------------------------------------------------------------+

#property copyright "SilverTrend  rewritten by CrazyChart"
#property link      "http://viac.ru/ "

#property indicator_chart_window
#property indicator_buffers 2
#property indicator_color1 Yellow
#property indicator_color2 Red

//---- input parameters
extern int        CountBars=400;
extern int        SSP=7;
extern double     Kmin=1.6;
extern double     Kmax=50.6;
extern bool       gAlert=True;            // Switch to allow alerts

//---- buffers
double ExtMapBuffer1[];
double ExtMapBuffer2[];

bool     gSellAlertGiven=false;           // Used to stop constant alerts
bool     gBuyAlertGiven=false;            // Used to stop constant alerts

//+------------------------------------------------------------------+
//| Custom indicator initialization function                         |
//+------------------------------------------------------------------+

int init()
{
   //---- indicators
   IndicatorBuffers(2);
   SetIndexStyle(0,DRAW_LINE,0,1,DarkOrange);
   SetIndexBuffer(0,ExtMapBuffer1);
   SetIndexStyle(1,DRAW_LINE,0,1,Red);
   SetIndexBuffer(1,ExtMapBuffer2);

   return(0);
}

//+------------------------------------------------------------------+
//| Custor indicator deinitialization function                       |
//+------------------------------------------------------------------+

int deinit()
{

   return(0);

}

//+------------------------------------------------------------------+
//| Custom indicator iteration function                              |
//+------------------------------------------------------------------+

int start()
{

   int      i,
            i2,
            loopbegin,
            counted_bars=IndicatorCounted();

   double   SsMax,
            SsMin,
            K,
            val1,
            val2,
            smin,
            smax,
            price;

   if (CountBars>=Bars){
      CountBars=Bars;
   }

   SetIndexDrawBegin(0,Bars-CountBars+SSP);
   SetIndexDrawBegin(1,Bars-CountBars+SSP);

   if(Bars<=SSP+1){
      return(0);
   }

   if(Bars<=SSP+1){
      return(0);
   }

   //---- initial zero

   if(counted_bars<SSP+1){
      for(i=1;i<=SSP;i++) ExtMapBuffer1[CountBars-i]=0.0;
      for(i=1;i<=SSP;i++) ExtMapBuffer2[CountBars-i]=0.0;
   }

   //+++++++-SSP

   for(i=CountBars-SSP;i>=0;i--) {

      SsMax = High[Highest(NULL,0,MODE_HIGH,SSP,i-SSP+1)];
      SsMin = Low[Lowest(NULL,0,MODE_LOW,SSP,i-SSP+1)];
      smin = SsMin-(SsMax-SsMin)*Kmin/100;
      smax = SsMax-(SsMax-SsMin)*Kmax/100;
      ExtMapBuffer1[i-SSP+6]=smax;
      ExtMapBuffer2[i-SSP-1]=smax;
      val1 = ExtMapBuffer1[0];
      val2 = ExtMapBuffer2[0];

      if (val1 > val2){
         Comment("ïîêóïêà buy ",val1);
         if( gAlert==true && gBuyAlertGiven==false){
            PlaySound("alert.wav");
            Alert("Buy signal at " + DoubleToStr(val1, 4) + " on " + Period() + " minute chart");
            gBuyAlertGiven=true;
            gSellAlertGiven=false;
         }
      }

      if (val1 < val2){
         Comment("ïðîäàæà sell ",val2);
         if(gAlert==true && gSellAlertGiven==false){
            PlaySound("alert.wav");
            Alert("Sell signal at " + DoubleToStr(val2, 4) + " on " + Period()+ " minute chart");
            gBuyAlertGiven=false;
            gSellAlertGiven=true;
         }
      }
   }

   return(0);
}


/////////////////////////////////////////////////////////////////////////////
// History
/////////////////////////////////////////////////////////////////////////////
/*

22 September 2005 by Varus

variables added:

gAlert                  External switch to allow alerts.
gBuyAlertGiven          Global to stop the alerts being displayed more than once.
gSellAlertGiven         Global to stop the alerts being displayed more than once.

An alert was added to alert the trader when the indicator changes from a long signal
to a short or the other way round.

The value of CountBars was changed to 400 from 300 to give a longer display of previous
performance on the price chart.

Version number v1.01 added to filename.

*/
Comments