SilverTrend_v1
Download script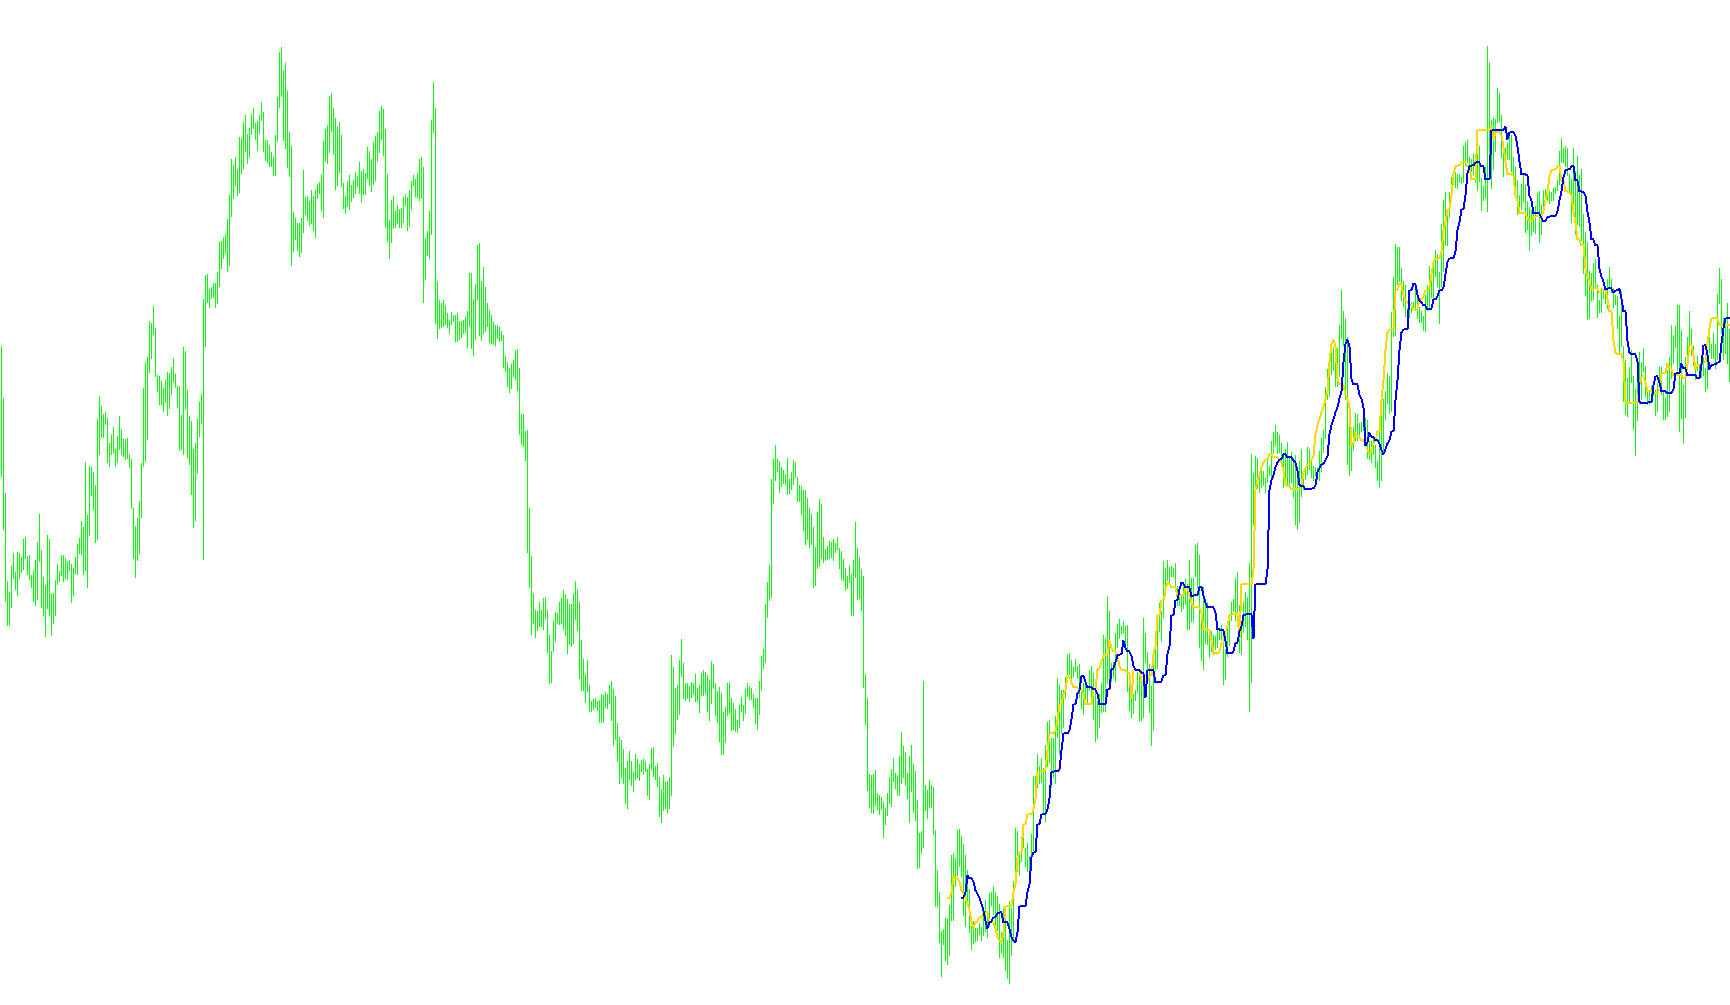
This tool is designed to analyze market price movements and provide visual cues regarding potential trend shifts. By evaluating the relationship between recent price highs and lows, it helps traders identify specific momentum points where the market might be transitioning.
How the Logic Works
Price Range Analysis The script constantly scans a specific window of historical data (determined by the user's settings) to identify the highest and lowest prices reached during that period. Instead of just looking at the current price, it looks at the "container" of recent price action to establish boundaries.
Dynamic Thresholds Once the high and low points are identified, the logic calculates two distinct levels:
- Upper Boundary: A calculated value based on a percentage of the total price range.
- Lower Boundary: A secondary value that tracks relative movements within that same range.
The script compares these two values as they develop over time. Because these values are derived from moving highs and lows, they create smooth lines on your chart rather than jagged jumps.
Signal Detection The primary goal of the logic is to detect "crosses" between these calculated values:
- Buy Signals: When the primary value shifts to be higher than the secondary value, it suggests upward momentum. The script will display a "buy" comment on the screen and can trigger an audible alert or pop-up notification.
- Sell Signals: Conversely, when the primary value drops below the secondary value, it indicates downward pressure. The script responds by displaying a "sell" comment and triggering a corresponding alert.
Key Features for the User
- Visual Tracking: You can see the price boundaries moving in real-time, allowing you to observe how the market's "range" is expanding or contracting.
- Automated Alerts: To ensure you don't have to watch the screen constantly, the tool includes a notification system that plays a sound and sends a popup alert the moment a new signal is detected.
- Smart Filtering: The logic includes a "memory" function for alerts; it is designed to notify you only once when a trend changes, rather than sending repeated sounds for every single tick of price movement.
- Adjustable Sensitivity: Through the input settings, users can modify how many bars of history are analyzed and adjust the mathematical weights (K-values) that define the upper and lower boundaries, making it adaptable to different trading styles or timeframes.
/*-----------------------------+
|			       |
| Shared by www.Aptrafx.com    |
|			       |
+------------------------------*/

//+------------------------------------------------------------------+
//|              Filename changed to ForexOFFTrend.mq4 by CrazyChart |
//|                                                 SilverTrend .mq4 |
//|                              SilverTrend rewritten by CrazyChart |
//|                                                  http://viac.ru/ |
//+------------------------------------------------------------------+

#property copyright "SilverTrend rewritten by CrazyChart"
#property link "http://viac.ru/ "
//----
#property indicator_chart_window
#property indicator_buffers 2
#property indicator_color1 Blue
#property indicator_color2 Red
//---- input parameters
extern int CountBars = 400;
extern int SSP = 7;
extern double Kmin = 1.6;
extern double Kmax = 50.6;
extern bool gAlert = True; // Switch to allow alerts
//---- buffers
double ExtMapBuffer1[];
double ExtMapBuffer2[];
//----
bool gSellAlertGiven = false; // Used to stop constant alerts
bool gBuyAlertGiven = false; // Used to stop constant alerts
//+------------------------------------------------------------------+
//| Custom indicator initialization function                         |
//+------------------------------------------------------------------+
int init()
  {
//---- indicators
   SetIndexStyle(0, DRAW_LINE, 0, 2);
   SetIndexBuffer(0, ExtMapBuffer1);
   SetIndexStyle(1, DRAW_LINE, 0, 2);
   SetIndexBuffer(1, ExtMapBuffer2);
//----
   if(CountBars >= Bars)
       CountBars = Bars;
   SetIndexDrawBegin(0, Bars - CountBars + SSP);
   SetIndexDrawBegin(1, Bars - CountBars + SSP);
//----
   return(0);
  }
//+------------------------------------------------------------------+
//| Custor indicator deinitialization function                       |
//+------------------------------------------------------------------+
int deinit()
  {
   return(0);
  }
//+------------------------------------------------------------------+
//| Custom indicator iteration function                              |
//+------------------------------------------------------------------+
int start()
  {
   int i,
   i2,
   loopbegin,
   counted_bars = IndicatorCounted();
   double SsMax,
   SsMin,
   K,
   val1,
   val2,
   smin,
   smax,
   price;
   if(Bars <= SSP + 1)
       return(0);
//---- initial zero
   if(counted_bars < SSP + 1)
     {
       for(i = 1; i <= SSP; i++)
           ExtMapBuffer1[CountBars-i] = 0.0;
       for(i = 1; i <= SSP; i++)
           ExtMapBuffer2[CountBars-i] = 0.0;
     }
   for(i = CountBars - SSP; i >= 0; i--)
     {
       SsMax = High[Highest(NULL, 0, MODE_HIGH, SSP, i - SSP + 1)];
       SsMin = Low[Lowest(NULL, 0, MODE_LOW, SSP, i - SSP + 1)];
       smin = NormalizeDouble((SsMin - (SsMax - SsMin)*Kmin / 100), Digits);
       smax = NormalizeDouble((SsMax - (SsMax - SsMin)*Kmax / 100), Digits);
       ExtMapBuffer1[i-SSP+6] = smax;
       ExtMapBuffer2[i-SSP-1] = smax;
       val1 = ExtMapBuffer1[0];
       val2 = ExtMapBuffer2[0];
       if(val1 > val2)
         {
           Comment(Symbol()+ " buy ", val1);
           if(gAlert == true && gBuyAlertGiven == false)
             {
               PlaySound("alert.wav");

               Alert(Symbol()+" Buy signal at " + DoubleToStr(val1, Digits) + " on " + Period() +
                     " minute chart");
               gBuyAlertGiven = true;
               gSellAlertGiven = false;
             }
         }
       if(val1 < val2)
         {
           Comment(Symbol()+ " sell ", val2);
           if(gAlert == true && gSellAlertGiven == false)
             {
               PlaySound("alert.wav");
               Alert(Symbol()+" Sell signal at " + DoubleToStr(val2, Digits) + " on " + Period()+
                     " minute chart");
               gBuyAlertGiven = false;
               gSellAlertGiven=true;
             }
         }
     }
//----
   return(0);
  }
//+------------------------------------------------------------------+
Comments