ForexOffTrend_Alert_001
Download script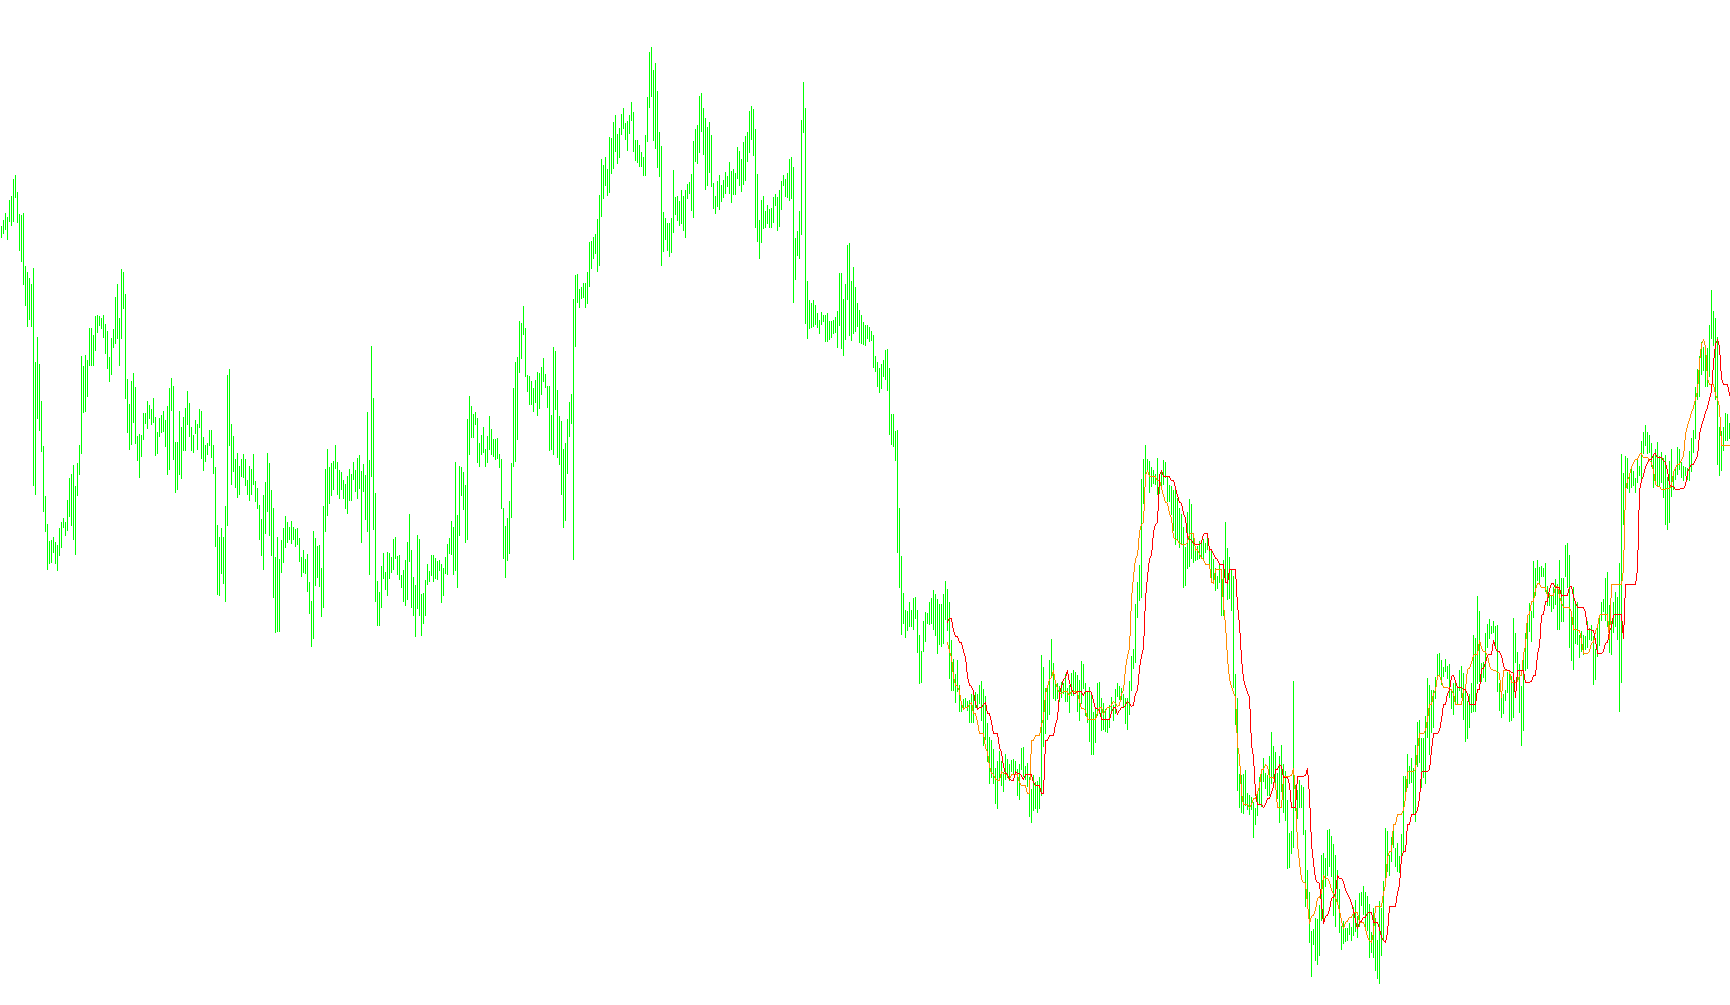
This tool is designed to help traders identify potential shifts in market momentum by analyzing price action over a specific historical window. Rather than focusing on every minor price fluctuation, the logic looks at broader "peaks" and "valleys" to determine where the price might be heading next.
How the Logic Works
The script operates by constantly scanning a set number of previous candles (the history) to establish a baseline for current market behavior. Here is the step-by-step breakdown of its internal process:
1. Identifying Extremes The tool looks at a rolling window of data to find the highest price (peak) and the lowest price (valley) reached during that timeframe. These points serve as the boundaries for recent price movement.
2. Calculating Dynamic Thresholds Instead of using fixed prices, the script calculates two dynamic levels based on the distance between those peaks and valleys:
- It establishes a high-end boundary and a low-end boundary relative to the current range.
- These boundaries act as "support" and "resistance" zones that adjust automatically as the market moves.
3. Tracking Momentum Shifts The core of the logic compares two different data points (represented visually on your chart as two lines). It is looking for a specific crossover or change in these values:
- Buy Signals: When the primary calculated value shifts higher than the secondary reference point, it suggests an upward momentum shift.
- Sell Signals: When the primary calculated value drops below the secondary reference point, it suggests a downward momentum shift.
4. Smart Notification System To ensure the trader isn't overwhelmed with constant notifications, the script includes a "memory" feature. It is programmed to only trigger an alert when the signal changes (e.g., moving from a Buy state to a Sell state). This prevents the system from repeating the same alert multiple times in a row for the same trend.
Summary for the Trader
Essentially, this script filters out "market noise" by focusing on significant price ranges. It alerts you when the relationship between current price momentum and historical extremes suggests a reversal or a strong move in a specific direction, providing a visual and audible cue to help time your entries or exits.
//+------------------------------------------------------------------+
//| Filename changed to ForexOFFTrend.mq4 by CrazyChart              |
//|                                                 SilverTrend .mq4 |
//|                             SilverTrend  rewritten by CrazyChart |
//|                                                 http://viac.ru/  |
//+------------------------------------------------------------------+

#property copyright "SilverTrend  rewritten by CrazyChart"
#property link      "http://viac.ru/ "

#property indicator_chart_window
#property indicator_buffers 2
#property indicator_color1 Yellow
#property indicator_color2 Red

//---- input parameters
extern int        CountBars=400;
extern int        SSP=7;
extern double     Kmin=1.6;
extern double     Kmax=50.6;
extern bool       gAlert=True;            // Switch to allow alerts

//---- buffers
double ExtMapBuffer1[];
double ExtMapBuffer2[];

bool     gSellAlertGiven=false;           // Used to stop constant alerts
bool     gBuyAlertGiven=false;            // Used to stop constant alerts

//+------------------------------------------------------------------+
//| Custom indicator initialization function                         |
//+------------------------------------------------------------------+

int init()
{
   //---- indicators
   IndicatorBuffers(2);
   SetIndexStyle(0,DRAW_LINE,0,1,DarkOrange);
   SetIndexBuffer(0,ExtMapBuffer1);
   SetIndexStyle(1,DRAW_LINE,0,1,Red);
   SetIndexBuffer(1,ExtMapBuffer2);

   return(0);
}

//+------------------------------------------------------------------+
//| Custor indicator deinitialization function                       |
//+------------------------------------------------------------------+

int deinit()
{

   return(0);

}

//+------------------------------------------------------------------+
//| Custom indicator iteration function                              |
//+------------------------------------------------------------------+

int start()
{

   int      i,
            i2,
            loopbegin,
            counted_bars=IndicatorCounted();

   double   SsMax,
            SsMin,
            K,
            val1,
            val2,
            smin,
            smax,
            price;

   if (CountBars>=Bars){
      CountBars=Bars;
   }

   SetIndexDrawBegin(0,Bars-CountBars+SSP);
   SetIndexDrawBegin(1,Bars-CountBars+SSP);

   if(Bars<=SSP+1){
      return(0);
   }

   if(Bars<=SSP+1){
      return(0);
   }

   //---- initial zero

   if(counted_bars<SSP+1){
      for(i=1;i<=SSP;i++) ExtMapBuffer1[CountBars-i]=0.0;
      for(i=1;i<=SSP;i++) ExtMapBuffer2[CountBars-i]=0.0;
   }

   //+++++++-SSP

   for(i=CountBars-SSP;i>=0;i--) {

      SsMax = High[Highest(NULL,0,MODE_HIGH,SSP,i-SSP+1)];
      SsMin = Low[Lowest(NULL,0,MODE_LOW,SSP,i-SSP+1)];
      smin = SsMin-(SsMax-SsMin)*Kmin/100;
      smax = SsMax-(SsMax-SsMin)*Kmax/100;
      ExtMapBuffer1[i-SSP+6]=smax;
      ExtMapBuffer2[i-SSP-1]=smax;
      val1 = ExtMapBuffer1[0];
      val2 = ExtMapBuffer2[0];

      if (val1 > val2){
         Comment("ïîêóïêà buy ",val1);
         if( gAlert==true && gBuyAlertGiven==false){
            PlaySound("alert.wav");
            Alert("Buy signal at " + DoubleToStr(val1, 4) + " on " + Period() + " minute chart");
            gBuyAlertGiven=true;
            gSellAlertGiven=false;
         }
      }

      if (val1 < val2){
         Comment("ïðîäàæà sell ",val2);
         if(gAlert==true && gSellAlertGiven==false){
            PlaySound("alert.wav");
            Alert("Sell signal at " + DoubleToStr(val2, 4) + " on " + Period()+ " minute chart");
            gBuyAlertGiven=false;
            gSellAlertGiven=true;
         }
      }
   }

   return(0);
}


/////////////////////////////////////////////////////////////////////////////
// History
/////////////////////////////////////////////////////////////////////////////
/*

22 September 2005 by Varus

variables added:

gAlert                  External switch to allow alerts.
gBuyAlertGiven          Global to stop the alerts being displayed more than once.
gSellAlertGiven         Global to stop the alerts being displayed more than once.

An alert was added to alert the trader when the indicator changes from a long signal
to a short or the other way round.

The value of CountBars was changed to 400 from 300 to give a longer display of previous
performance on the price chart.

Version number v1.01 added to filename.

*/
Comments