ForexOFFTrend indi_v1
Download script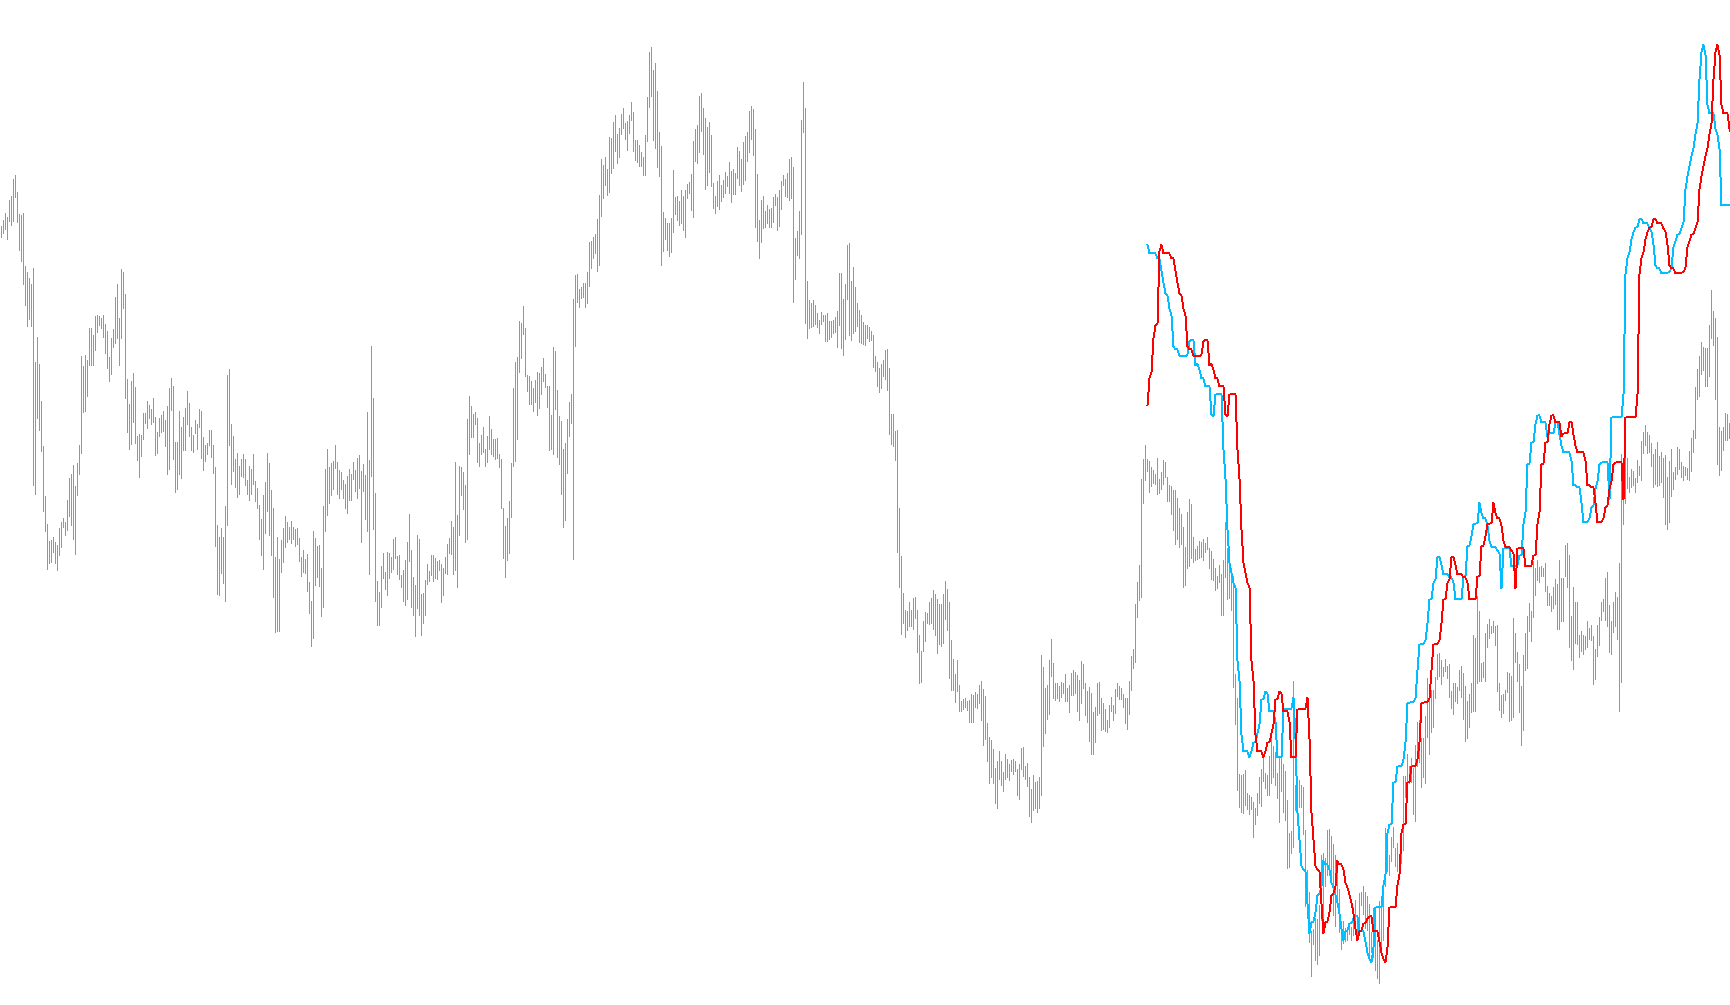
The SilverTrend tool is a visual market analysis indicator designed to help traders identify the prevailing trend direction on a price chart. Rather than cluttering the main price candles, it operates in a separate window, providing a smoothed visualization of market momentum.
Core Logic and Functionality
The script functions by constantly scanning historical price data over a specific lookback period (defined by the user). It identifies two key components of price action: the highest peak and the lowest trough within that timeframe. By analyzing the relationship between these extremes, the tool calculates a "trend boundary" based on specific percentage offsets.
How it Identifies Trends
The indicator processes the market data through the following steps:
- Range Calculation: It determines the total distance (volatility) between the highest high and the lowest low over a set number of bars.
- Dynamic Boundaries: Using these extremes, the logic establishes two different price levels based on mathematical percentages. These represent "support" and "resistance" zones that shift automatically as new price data enters the market.
- Trend Comparison: The tool compares these calculated boundaries against one another in real-time.
Visual Feedback for Traders
The primary goal of this script is to provide immediate, actionable cues on the screen:
- Visual Lines: It plots two distinct lines (typically colored in DeepSkyBlue and Red) that track the market's movement. These lines act as a visual representation of the "ceiling" and "floor" of the current trend.
- Dynamic Commentary: The script includes an automated labeling system. By comparing the values of its internal calculations, it provides live text feedback on the chart:
- When the primary calculation indicates upward momentum, it displays a "Buy" signal along with its corresponding value.
- When the calculation indicates downward momentum, it displays a "Sell" signal along with its value.
Summary of User Experience
For a non-technical user, this means the indicator does the heavy lifting of calculating price volatility and historical extremes. Instead of manually guessing whether the market is trending up or down, you can watch the two lines and read the automated "Buy" or "Sell" prompts, which signal when the trend has shifted based on the script's internal percentage logic.
/*-----------------------------+
|			       |
| Shared by www.Aptrafx.com    |
|			       |
+------------------------------*/

//+------------------------------------------------------------------+
//|                                                 SilverTrend .mq4 |
//|                             SilverTrend  rewritten by CrazyChart |
//|                                                 http://viac.ru/  |
//+------------------------------------------------------------------+
#property copyright "SilverTrend  rewritten by CrazyChart"
#property link      "http://viac.ru/ "

#property indicator_separate_window
#property indicator_buffers 2
#property indicator_color1 DeepSkyBlue   //Yellow
#property indicator_color2 Red
//---- input parameters


extern int       SSP=7;
extern double    Kmin=1.6;
extern double    Kmax=50.6; //24 21.6 21.6
extern int       CountBars=300;

//---- buffers
double ExtMapBuffer1[];
double ExtMapBuffer2[];
//+------------------------------------------------------------------+
//| Custom indicator initialization function                         |
//+------------------------------------------------------------------+
int init()
  {
//---- indicators
   IndicatorBuffers(2);
   SetIndexStyle(0,DRAW_LINE,0,2,DeepSkyBlue);  //Yellow
   SetIndexBuffer(0,ExtMapBuffer1);
   SetIndexStyle(1,DRAW_LINE,0,2,Red);
   SetIndexBuffer(1,ExtMapBuffer2);

  // IndicatorDigits(MarketInfo(Symbol(),MODE_DIGITS)+1);

   //===============SHORT NAME========================================
   string short_name;
   short_name="FxTrend("+SSP+")";
    IndicatorShortName(short_name);
     SetIndexLabel(0,short_name);


//----
   return(0);
  }
//+------------------------------------------------------------------+
//| Custor indicator deinitialization function                       |
//+------------------------------------------------------------------+
int deinit()
  {

   return(0);
  }
//+------------------------------------------------------------------+
//| Custom indicator iteration function                              |
//+------------------------------------------------------------------+
int start()
  {

  if (CountBars>=Bars) CountBars=Bars;
   SetIndexDrawBegin(0,Bars-CountBars+SSP);
   SetIndexDrawBegin(1,Bars-CountBars+SSP);
  int i, i2,loopbegin,counted_bars=IndicatorCounted();
  double SsMax, SsMin, K, val1, val2, smin, smax, price;

  if(Bars<=SSP+1) return(0);
  //---- initial zero

//K=33-RISK;

/*
if (firstTime==true)   {
   loopbegin = CountBars;
   if (loopbegin>(Bars-2*SSP+1)) loopbegin=Bars-2*SSP+1;
   firstTime=False;
}; ðóäèìåíò ñòàðîé ïðîãðàììû
*/
  if(Bars<=SSP+1) return(0);
//---- initial zero

//+++++++
if(counted_bars<SSP+1)
   {
      for(i=1;i<=SSP;i++) ExtMapBuffer1[CountBars-i]=0.0;
      for(i=1;i<=SSP;i++) ExtMapBuffer2[CountBars-i]=0.0;
   }
//+++++++-SSP


for(i=CountBars-SSP;i>=0;i--) {


  SsMax = High[Highest(NULL,0,MODE_HIGH,SSP,i-SSP+1)];
  SsMin = Low[Lowest(NULL,0,MODE_LOW,SSP,i-SSP+1)];
   smin = SsMin-(SsMax-SsMin)*Kmin/100;
   smax = SsMax-(SsMax-SsMin)*Kmax/100;
   ExtMapBuffer1[i-SSP+6]=smax;
   ExtMapBuffer2[i-SSP-1]=smax;
   val1 = ExtMapBuffer1[0];
   val2 = ExtMapBuffer2[0];
if (val1 > val2) Comment("Buy ",val1);

if (val1 < val2) Comment("Sell ",val2);


}


//----
   return(0);
  }
//+------------------------------------------------------------------+
Comments