Hour
Download script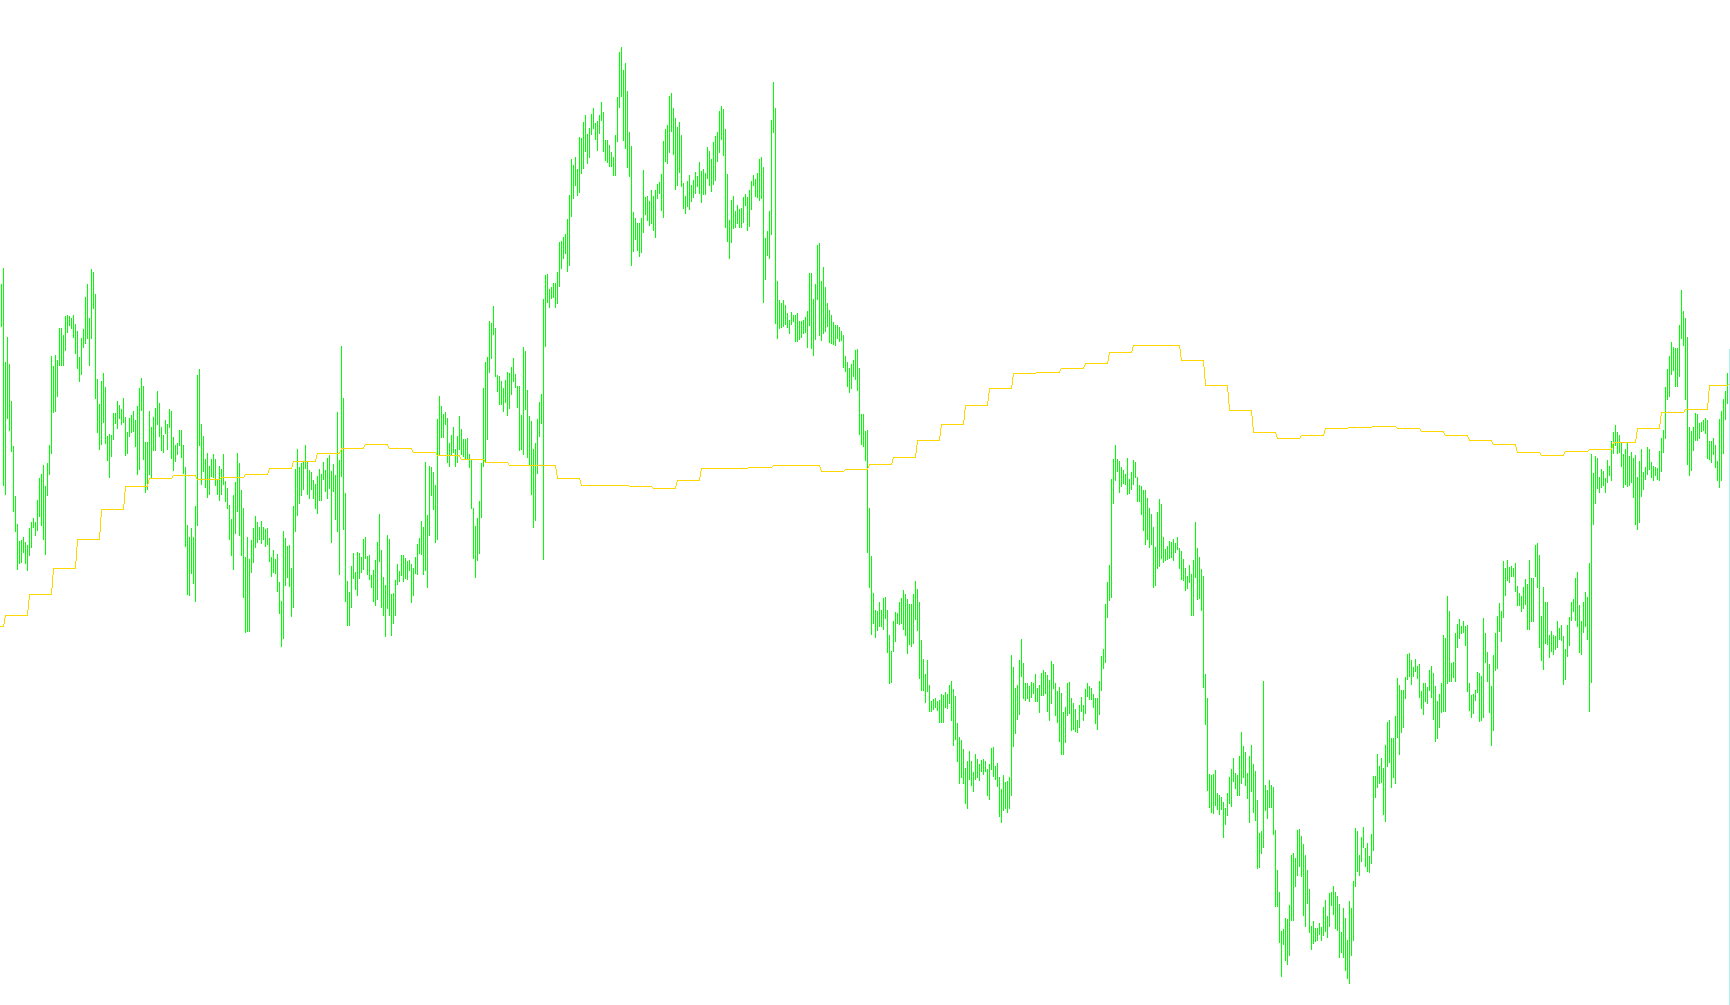
This script is a custom visual tool designed for the MetaTrader trading platform. Its primary purpose is to project three distinct trend lines on your chart simultaneously, helping you visualize price movement and potential momentum shifts based on different historical timeframes.
How the Logic Works
The indicator functions by calculating "Moving Averages"—a common financial analysis method used to smooth out price fluctuations—but it applies them in a unique way that creates a multi-layered perspective of the market. Instead of showing three lines that move at the same speed, this script adjusts the "lookback" period for each line dynamically based on its position on the chart.
Here is a breakdown of the three specific components:
- The Long-Term Trend (Blue Line): This represents the broader market direction. It looks back over a large window of data (60 units), providing a smooth, steady path that filters out minor "noise" or temporary price spikes. Because it uses a larger timeframe calculation, it moves more slowly and reflects the macro trend.
- The Medium-Term Trend (Yellow Line): This serves as the bridge between the major trends and immediate price action. By looking back over 15 units of data, it reacts faster than the blue line but remains stable enough to show the prevailing sentiment of the current trading session.
- The Short-Term Trend (Red Line): This is the most reactive of the three lines. It monitors a very small window of data (5 units), allowing it to hug the price closely and reflect immediate changes or rapid momentum shifts in real-time.
The Dynamic Calculation
What makes this specific script unique is that it doesn't just apply a fixed average to the current candle. It uses a mathematical division system to adjust the depth of these averages as you move backward in time on your chart. This means that while the lines may appear to converge or diverge, they are constantly calculating their position relative to how far back into history the data goes.
Visual Summary
By placing all three lines on one screen, the tool allows you to see "confluence." When all three lines align in the same direction, it suggests a strong, unified trend. Conversely, when the lines begin to cross or move in opposite directions (for example, if the red line turns down while the blue line stays up), it can signal that the immediate momentum is changing against the broader trend.
//+------------------------------------------------------------------+
//|                                                         Hour.mq4 |
//|                      Copyright © 2006, MetaQuotes Software Corp. |
//|                                        http://www.metaquotes.net |
//+------------------------------------------------------------------+
#property copyright "Copyright © 2006, MetaQuotes Software Corp."
#property link      "http://www.metaquotes.net"
//----
#property indicator_chart_window
#property indicator_buffers 3
#property indicator_color1 Blue
#property indicator_color2 Yellow
#property indicator_color3 Red
//---- buffers
double ExtMapBuffer1[];
double ExtMapBuffer2[];
double ExtMapBuffer3[];
//+------------------------------------------------------------------+
//| Custom indicator initialization function                         |
//+------------------------------------------------------------------+
int init()
  {
//---- indicators
   SetIndexStyle(0,DRAW_LINE);
   SetIndexBuffer(0,ExtMapBuffer1);
   SetIndexStyle(1,DRAW_LINE);
   SetIndexBuffer(1,ExtMapBuffer2);
   SetIndexStyle(2,DRAW_LINE);
   SetIndexBuffer(2,ExtMapBuffer3);
//----
   return(0);
  }
//+------------------------------------------------------------------+
//| Custom indicator deinitialization function                       |
//+------------------------------------------------------------------+
int deinit()
  {
//----
//----
   return(0);
  }
//+------------------------------------------------------------------+
//| Custom indicator iteration function                              |
//+------------------------------------------------------------------+
int start()
  {
   int limit;
   int counted_bars=IndicatorCounted();
//---- ïîñëåäíèé ïîñ÷èòàííûé áàð áóäåò ïåðåñ÷èòàí
   if(counted_bars>0) counted_bars--;
   limit=Bars-counted_bars;
//---- îñíîâíîé öèêë
   for(int i=0; i<limit; i++)
     {
      ExtMapBuffer1[i]=iMA(NULL,60,5,0,0,0,i/12);
      ExtMapBuffer2[i]=iMA(NULL,15,5,0,0,0,i/3);
      ExtMapBuffer3[i]=iMA(NULL,5,5,0,0,0,i);
     }
//----
   return(0);
  }
//+------------------------------------------------------------------+
Comments