fibocalc_V31_v2
Download script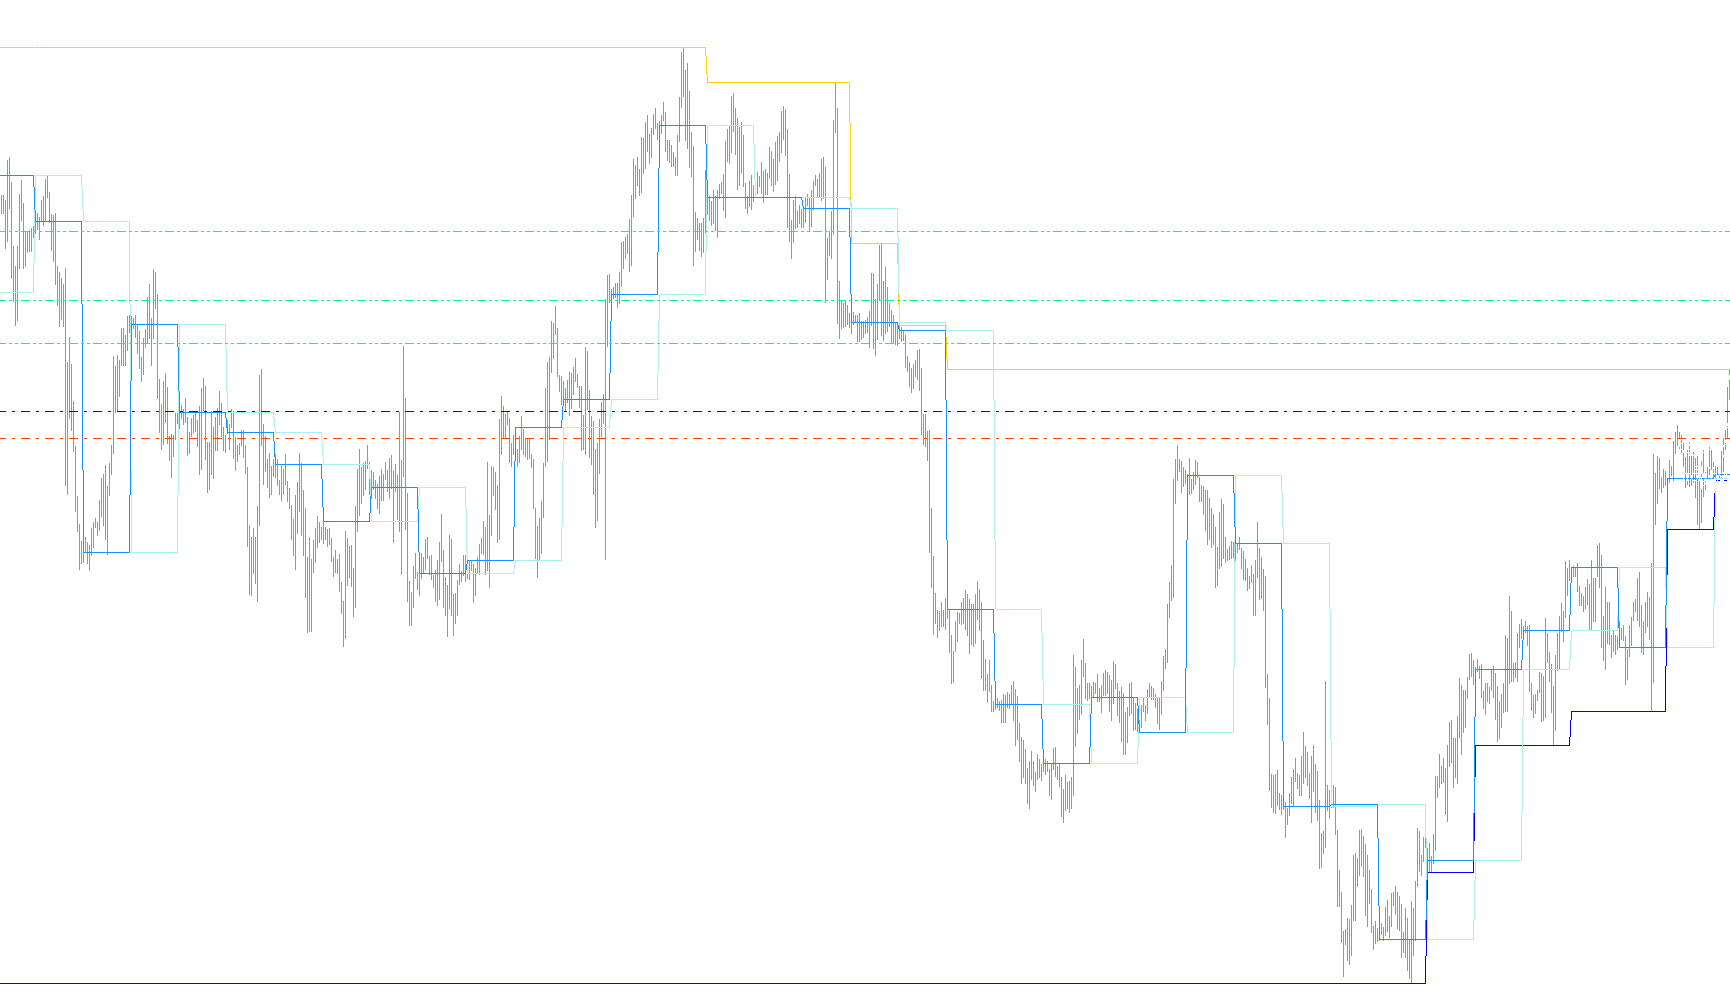
This tool is designed to provide traders with a visual and automated way to identify key price levels based on the previous day's trading activity. It specifically focuses on "Fibonacci" style retracements, which are common techniques used by traders to find potential entry points where price might pull back before continuing its trend.
How the Logic Works
1. Daily Data Tracking The script constantly monitors the market to identify four critical pieces of information from the previous trading day:
- The highest price reached (Day High)
- The lowest price reached (Day Low)
- The opening price (Day Open)
- The closing price (Day Close)
Once a new day begins, the script captures these values and draws them on your chart as clear labels so you can see exactly where the previous day's boundaries were set.
2. Dynamic Entry and Exit Levels Instead of just showing the high and low, the script uses these numbers to calculate specific mathematical levels for active trading:
- For Buy Opportunities: If the current market price is above the previous day's closing price (suggesting an upward trend), the script calculates a "Buy Level." It also automatically generates three potential Profit Targets and one Stop-Loss level based on Fibonacci ratios.
- For Sell Opportunities: If the current market price is below the previous day's closing price (suggesting a downward trend), the script identifies a "Sell Level" and provides corresponding Profit Targets and a Stop-Loss level.
3. Automatic Risk/Reward Validation One of the most useful features for a manual trader is the script’s built-in "sanity check." For every trade it suggests, it calculates the Risk/Reward Ratio.
- It checks if the potential profit from your targets justifies the risk of the stop-loss.
- If the ratios are high enough (specifically greater than 2), the script will display an "OK Trade" message in the corner of your screen.
- If the trade does not meet these mathematical requirements, it will clearly label them as "NO TRADE," helping you avoid low-probability setups where the potential reward doesn't make up for the risk.
4. Visual Aids on the Chart To keep the trading experience clean and professional, the script handles all the "heavy lifting" of drawing:
- Horizontal Lines: It draws dashed lines for your Buy/Sell levels, Stop-Losses, and various Profit Targets.
- Color Coding: It uses distinct colors (such as Blue for Buys, Red for Sells, and OrangeRed for Stop-Losses) to help you identify different zones at a glance.
- Real-time Updates: As the price moves, these levels update automatically on your chart, ensuring you are always looking at current data based on the last completed day's range.
/*-----------------------------+
|			       |
| Shared by www.Aptrafx.com    |
|			       |
+------------------------------*/

/*+------------------------------------------------------------------+
 | fibo
 | Author: Copyright © 2006,
 |
 |
 +------------------------------------------------------------------+*/
#property copyright "Copyright © 2006,"
#property link      "http://www.metaquotes.net"

#property indicator_chart_window
#property indicator_buffers 4

#property indicator_color1 DarkGreen
#property indicator_color2 Maroon
#property indicator_color3 Yellow
#property indicator_color4 Goldenrod


//---- input parameters

//---- buffers

double PrevDayHiBuffer[];
double PrevDayLoBuffer[];
double PrevDayOpenBuffer[];
double PrevDayCloseBuffer[];


int fontsize=8;
double PrevDayHi, PrevDayLo, PrevDayOpen , PrevDayClose,fb,fs,fe,tp1,tp2,tp3;
double LastHigh,LastLow,LastOpen,LastClose,x;
double ri,re1,re2,re3,ra1,ra2,ra3;


//+------------------------------------------------------------------+
//| Custor indicator deinitialization function                       |
//+------------------------------------------------------------------+
int deinit()
  {
//---- TODO: add your code here


   ObjectDelete("PrevDayHi");
   ObjectDelete("PrevDayLo");
   ObjectDelete("PrevDayOpen");
   ObjectDelete("PrevDayClose");
   ObjectDelete("fe");ObjectDelete("fe Line");
   ObjectDelete("fs");ObjectDelete("fs Line");
   ObjectDelete("tp3");ObjectDelete("tp3 Line");
   ObjectDelete("tp2");ObjectDelete("tp2 Line");
   ObjectDelete("tp1");ObjectDelete("tp1 Line");
   ObjectDelete("fb");ObjectDelete("fb Line");
  //   ObjectsDeleteAll();
//  Not a good idea to use ObjectDeleteAll function.
// It will delete ALL object on the chart
// not just the ones created by this indicator
//
//----
   return(0);
  }
//+------------------------------------------------------------------+
//| Custom indicator initialization function                         |
//+------------------------------------------------------------------+

int init()
  {
   string short_name;


//---- indicator line
   SetIndexStyle(0,DRAW_LINE);
   SetIndexStyle(1,DRAW_LINE);
   SetIndexStyle(2,DRAW_LINE);
   SetIndexStyle(3,DRAW_LINE);


   SetIndexBuffer(0, PrevDayHiBuffer);
   SetIndexBuffer(1, PrevDayLoBuffer);
   SetIndexBuffer(2, PrevDayOpenBuffer);
   SetIndexBuffer(3, PrevDayCloseBuffer);


//---- name for DataWindow and indicator subwindow label
   short_name="Prev Hi-Lo levels";
   IndicatorShortName(short_name);
   SetIndexLabel(0, short_name);

//----
   SetIndexDrawBegin(0,1);
//----


//----
   return(0);
  }

//+------------------------------------------------------------------+
//| Custom indicator iteration function                              |
//+------------------------------------------------------------------+
int start() {

   int    counted_bars=IndicatorCounted();

   int limit, i;
//---- indicator calculation
   if (counted_bars==0)
   {
      x=Period();
      if (x>240) return(-1);

   //---- last counted bar will be recounted
   //   if(counted_bars>0) counted_bars--;
   }
   limit=(Bars-counted_bars)-1;


   for (i=limit; i>=0;i--)
   {

     LastHigh=High[Highest(NULL,0,MODE_HIGH,i+1)];
     LastLow=Low[Lowest(NULL,0,MODE_LOW,i+1)];
     if (Open[i+1]>LastOpen) LastOpen=Open[i+1];

//Print("TimeDay(Time[i]=",TimeDay(Time[i]),"TimeDay(Time[i+1])",TimeDay(Time[i+1]));
     if (TimeDay(Time[i])!=TimeDay(Time[i+1]))
     {
       RefreshRates( ) ;

       PrevDayHi=LastHigh;
       PrevDayLo=LastLow;
       PrevDayOpen=LastClose;
       PrevDayClose=Open[i];

       LastLow=Open[i];
       LastHigh=Open[i];
       LastOpen=Open[i];
       LastClose=Open[i];

       if(ObjectFind("PrevDayHi") != 0)
       {
          ObjectCreate("PrevDayHi", OBJ_TEXT, 0, 0, 0);
          ObjectSetText("PrevDayHi", "                Day High",fontsize,"Arial", White);
       }
       else
       {
         ObjectMove("PrevDayHi", 0, Time[i], PrevDayHi);
       }

       if(ObjectFind("PrevDayLo") != 0)
       {
         ObjectCreate("PrevDayLo", OBJ_TEXT, 0, 0, 0);
         ObjectSetText("PrevDayLo", "                Day Low",fontsize,"Arial", White);
       }
       else
       {
         ObjectMove("PrevDayLo", 0, Time[i], PrevDayLo);
       }

       if(ObjectFind("PrevDayOpen") != 0)
       {
         ObjectCreate("PrevDayOpen", OBJ_TEXT, 0, 0, 0);
         ObjectSetText("PrevDayOpen", "                Prev. Day Open",fontsize,"Arial", White);
       }
       else
       {
         ObjectMove("PrevDayOpen", 0, Time[i], PrevDayOpen);
       }

       if(ObjectFind("PrevDayClose") != 0)
       {
         ObjectCreate("PrevDayClose", OBJ_TEXT, 0, 0, 0);
         ObjectSetText("PrevDayClose", "                Prev. Day Close",fontsize,"Arial", White);
       }
       else
       {
         ObjectMove("PrevDayClose", 0, Time[i], PrevDayClose);
       }

     }

     PrevDayHiBuffer[i]=PrevDayHi;
     PrevDayLoBuffer[i]=PrevDayLo;
     PrevDayOpenBuffer[i]=PrevDayOpen;
     PrevDayCloseBuffer[i]=PrevDayClose;

   }

// BUY
   if (Ask > LastClose) {
     fb= PrevDayHi-(PrevDayHi-PrevDayLo)*0.382;
     fe= PrevDayHi-(PrevDayHi-PrevDayLo)*0.618;
     tp1=((PrevDayHi-PrevDayLo)*0.618)+fb;
     tp2=(PrevDayHi-PrevDayLo)+fb;
     tp3=1.618*(PrevDayHi-PrevDayLo)+fb;
     ri=MathRound((+fb-fe)*10000)/10000;
     re1=MathRound((+tp1-fb)*10000)/10000;
     re2=MathRound((+tp2-fb)*10000)/10000;
     re3=MathRound((+tp3-fb)*10000)/10000;
     ra1=MathRound((+re1/ri)*10)/10;
     ra2=MathRound((+re2/ri)*10)/10;
     ra3=MathRound((+re3/ri)*10)/10;
     RefreshRates( ) ;
     if(ObjectFind("fb") != 0)
     {
        ObjectCreate("fb", OBJ_TEXT, 0, Time[0], fb);
        ObjectSetText("fb", " BUY LEVEL", 8, "Arial", EMPTY);
     }
     else
     {
        ObjectMove("fb",fb, Time[0], fb);
     }
     if(ObjectFind("fb Line") != 0)
     {
        ObjectCreate("fb Line", OBJ_HLINE, 0, Time[0],fb);
        ObjectSet("fb Line", OBJPROP_STYLE, STYLE_DASHDOT);
        ObjectSet("fb Line", OBJPROP_COLOR, Blue);
     }
     else
     {
        ObjectMove("fb Line",0, Time[0], fb);
     }


     if((ra1>2)&&(ra2>2)&&(ra3>2))
        Comment("Owner : ", AccountName()," Account number : ", AccountNumber(),
        "\n\nPrevDayHi ",PrevDayHi,"\nPrevDayLo ", PrevDayLo,"\nTrend was UP ",
        "\nBUY @ ",fb ,"\nStopLoss ",fe,"\nTakeProit 1 ",tp1 ,
        " Risk/Reward Ratio : ", ra1 ," OK Trade ","\nTakeProit 2 ",tp2 ,
        " Risk/Reward Ratio : ", ra2 ," OK Trade ","\nTakeProit 3 ",tp3,
        " Risk/Reward Ratio : ", ra3 ," OK Trade ");
     else
        Comment("Owner : ", AccountName()," Account number : ", AccountNumber(),
        "\n\nPrevDayHi ",PrevDayHi,"\nPrevDayLo ", PrevDayLo,"\nTrend was UP ",
        "\nBUY @ ",fb ,"\nStopLoss ",fe,"\nTakeProit 1 ",tp1 ,
        " Risk/Reward Ratio : ", ra1 ," NO TRADE ","\nTakeProit 2 ",tp2 ,
        " Risk/Reward Ratio : ", ra2 ," NO TRADE ","\nTakeProit 3 ",tp3,
        " Risk/Reward Ratio : ", ra3 ," NO TRADE ");

   }

// SELL
   if (Bid < LastClose) {
     fs=(PrevDayHi-PrevDayLo)*0.382+(PrevDayLo);
     fe=(PrevDayHi-PrevDayLo)*0.618+(PrevDayLo);
     tp1=((PrevDayLo-PrevDayHi)*0.618)+fs;
     tp2=(PrevDayLo-PrevDayHi)+fs;
     tp3=1.618*(PrevDayLo-PrevDayHi)+fs;
     ri=MathRound((+fs-fe)*10000)/10000;
     re1=MathRound((+tp1-fs)*10000)/10000;
     re2=MathRound((+tp2-fs)*10000)/10000;
     re3=MathRound((+tp3-fs)*10000)/10000;
     ra1=MathRound((+re1/ri)*10)/10;
     ra2=MathRound((+re2/ri)*10)/10;
     ra3=((+re3/ri)*10)/10;
     RefreshRates( ) ;
     if(ObjectFind("fs") != 0)
     {
        ObjectCreate("fs", OBJ_TEXT, 0, Time[0], fs);
        ObjectSetText("fs", " SELL LEVEL", 8, "Arial", EMPTY);
     }
     else
     {
        ObjectMove("fs",fs, Time[0], fs);
     }
     if(ObjectFind("fs Line") != 0)
     {
        ObjectCreate("fs Line", OBJ_HLINE, 0, Time[0],fs);
        ObjectSet("fs Line", OBJPROP_STYLE, STYLE_DASHDOT);
        ObjectSet("fs Line", OBJPROP_COLOR, Red);
     }
     else
     {
        ObjectMove("fs Line",0, Time[0], fs);
     }


     if((ra1>2)&&(ra2>2)&&(ra3>2))
        Comment("Owner : ", AccountName(),"Account number : ", AccountNumber(),
        "\n\nPrevDayHi ",PrevDayHi,"\nPrevDayLo ", PrevDayLo,"\nTrend was Down ",
        "\nSELL @ ",fs ,"\nStopLoss ",fe,"\nTakeProit 1 ",tp1 ,
        " Risk/Reward Ratio : ", ra1 ," OK Trade ","\nTakeProit 2 ",tp2 ,
        " Risk/Reward Ratio : ", ra2 ," OK Trade ","\nTakeProit 3 ",tp3,
        " Risk/Reward Ratio : ", ra3 ," OK Trade ");
     else
        Comment("Owner : ", AccountName(),"Account number : ", AccountNumber(),
        "\n\nPrevDayHi ",PrevDayHi,"\nPrevDayLo ", PrevDayLo,"\nTrend was Down ",
        "\nSELL @ ",fs ,"\nStopLoss ",fe,"\nTakeProit 1 ",tp1 ,
        " Risk/Reward Ratio : ", ra1 ," NO TRADE ","\nTakeProit 2 ",tp2 ,
        " Risk/Reward Ratio : ", ra2 ," NO TRADE ","\nTakeProit 3 ",tp3,
        " Risk/Reward Ratio : ", ra3 ," NO TRADE ");


   }
     if(ObjectFind("fe") != 0)
     {
        ObjectCreate("fe", OBJ_TEXT, 0, Time[0], fe);
        ObjectSetText("fe", " STOPLOSS LEVEL", 8, "Arial", EMPTY);
     }
     else
     {
        ObjectMove("fe",fe, Time[0], fe);
     }
     if(ObjectFind("fe Line") != 0)
     {
        ObjectCreate("fe Line", OBJ_HLINE, 0, Time[0],fe);
        ObjectSet("fe Line", OBJPROP_STYLE, STYLE_DASHDOT);
        ObjectSet("fe Line", OBJPROP_COLOR,OrangeRed );
     }
     else
     {
        ObjectMove("fe Line",0, Time[0], fe);
     }

     if(ObjectFind("tp1") != 0)
     {
        ObjectCreate("tp1", OBJ_TEXT, 0, Time[0], tp1);
        ObjectSetText("tp1", " PROFIT TARGET 1", 8, "Arial", EMPTY);
     }
     else
     {
        ObjectMove("tp1",tp1, Time[0],tp1 );
     }

     if(ObjectFind("tp1 Line") != 0)
     {
        ObjectCreate("tp1 Line", OBJ_HLINE, 0, Time[0],tp1);
        ObjectSet("tp1 Line", OBJPROP_STYLE, STYLE_DASHDOTDOT);
        ObjectSet("tp1 Line", OBJPROP_COLOR,SpringGreen );
     }
     else
     {
        ObjectMove("tp1 Line",0, Time[0],tp1 );
     }

     if(ObjectFind("tp2") != 0)
     {
        ObjectCreate("tp2", OBJ_TEXT, 0, Time[0], tp2);
        ObjectSetText("tp2", " PROFIT TARGET 2", 8, "Arial", EMPTY);
     }
     else
     {
        ObjectMove("tp2",tp2, Time[0],tp2);
     }
     if(ObjectFind("tp2 Line") != 0)
     {
        ObjectCreate("tp2 Line", OBJ_HLINE, 0, Time[0],tp2);
        ObjectSet("tp2 Line", OBJPROP_STYLE, STYLE_DASHDOTDOT);
        ObjectSet("tp2 Line", OBJPROP_COLOR,SpringGreen );
     }
     else
     {
        ObjectMove("tp2 Line",0, Time[0],tp2);
     }

     if(ObjectFind("tp3") != 0)
     {
        ObjectCreate("tp3", OBJ_TEXT, 0, Time[0], tp3);
        ObjectSetText("tp3", " PROFIT TARGET 3", 8, "Arial", EMPTY);
     }
     else
     {
        ObjectMove("tp3",tp3, Time[0],tp3);
     }
     if(ObjectFind("tp3 Line") != 0)
     {
        ObjectCreate("tp3 Line", OBJ_HLINE, 0, Time[0],tp3);
        ObjectSet("tp3 Line", OBJPROP_STYLE, STYLE_DASHDOTDOT);
        ObjectSet("tp3 Line", OBJPROP_COLOR,SpringGreen );
     }
     else
     {
        ObjectMove("tp3 Line",0, Time[0],tp3);
     }

//----
   return(0);
  }
//+------------------------------------------------------------------+
Comments