EntropyMath_HSigMA
Download script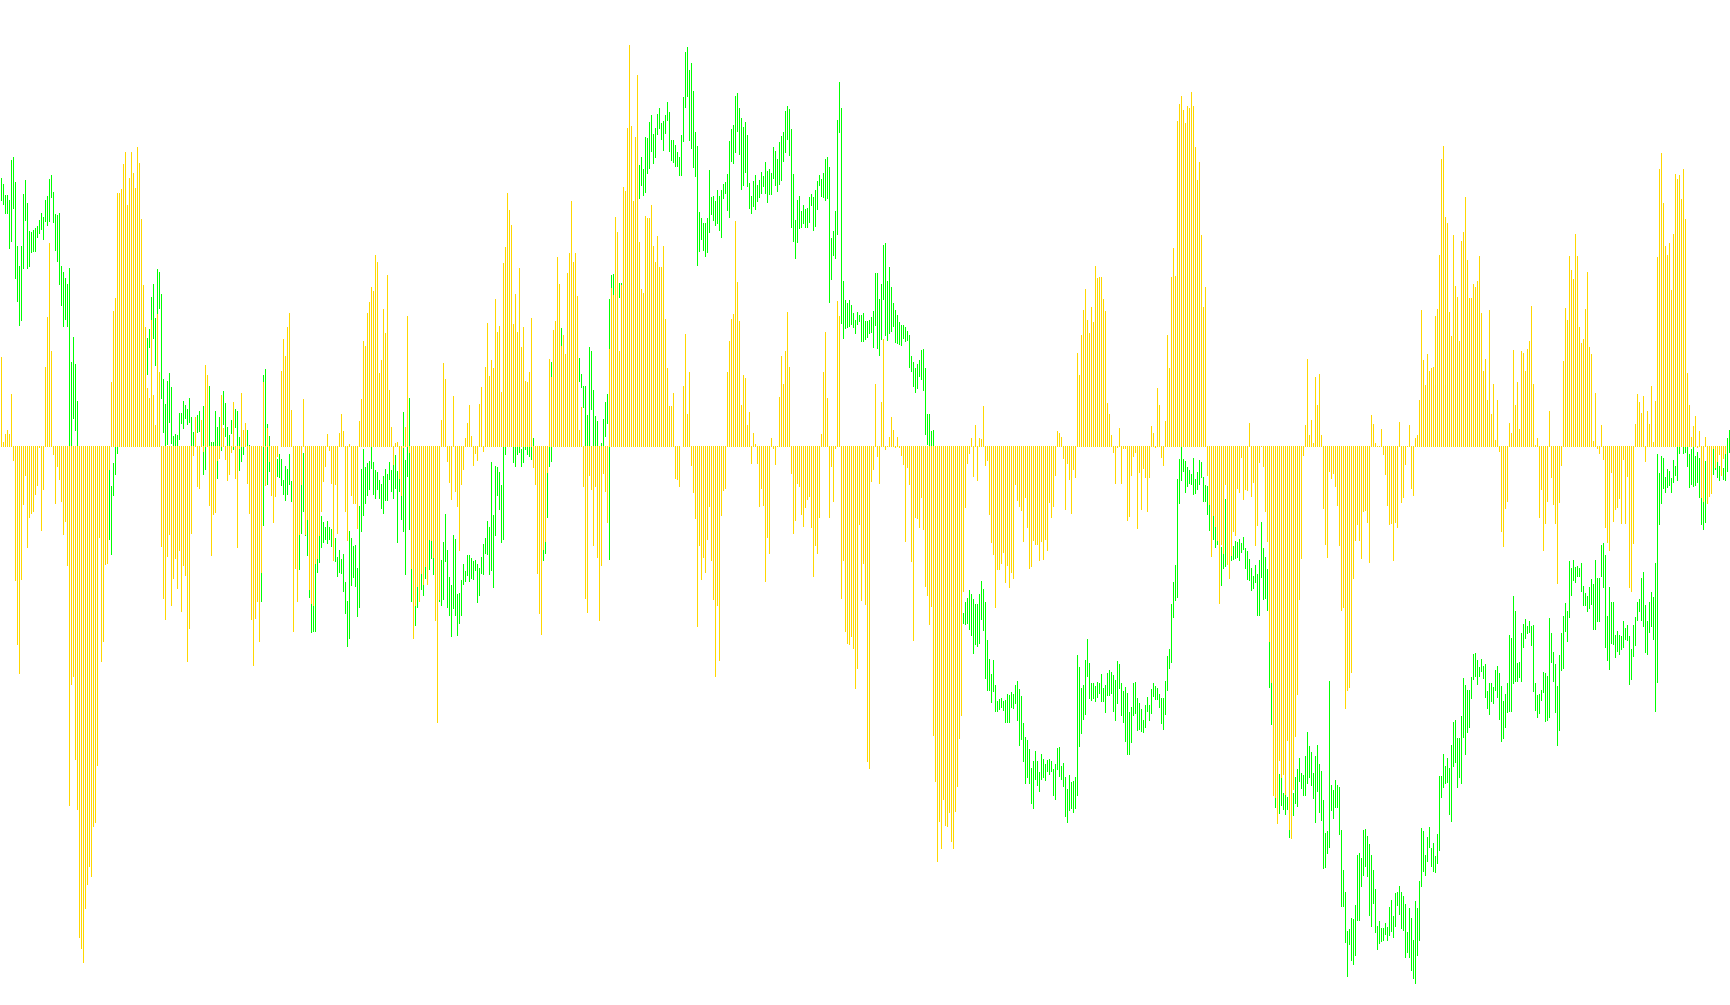
This tool is designed to measure and visualize the underlying "chaos" or uncertainty within financial market price movements. Rather than simply looking at whether a price is going up or down, it analyzes the complexity of the price action over a specific period to help traders understand the stability of the current market trend.
How the Logic Works
The script operates by examining a user-defined number of recent price bars (the "lookback" period) and performing the following steps:
1. Measuring Relative Change The tool first calculates the rate of change between consecutive closing prices. By looking at these changes, it establishes a mathematical baseline for how much the price is moving from one moment to the next.
2. Calculating Volatility and Average Movement It then processes these changes to determine two key metrics:
- The Average: The typical size of the price moves.
- The Root Mean Square (RMS): A measure of the variance or "spread" in those moves. This helps the tool distinguish between steady, consistent movement and erratic, unpredictable jumps.
3. Determining Entropy Using these averages and variances, the script applies a mathematical formula to calculate "Entropy." In this context, entropy represents the degree of randomness in the market:
- Low entropy suggests more predictable, structured behavior.
- High entropy suggests more chaotic, disorganized, or volatile behavior.
Visual Representation
The tool provides two distinct visual elements to help with analysis:
- The Histogram (Primary Data): This shows the raw Entropy value. It allows you to see fluctuations in market randomness in real-time. Significant shifts in this histogram can indicate a change in market "mood" or the breakdown of a previous trend.
- The Signal Line: To make the data easier to read, the script creates a smoothed average of the entropy values. This line filters out minor "noise," making it easier to identify broader trends in market stability and helping to distinguish between temporary blips and meaningful shifts in market dynamics.
//+------------------------------------------------------------------+
//|                                                  EntropyMath.mq4 |
//|                                         Aleksandr Pak            |
//+------------------------------------------------------------------+

#property  copyright "Copyright © 2008, MetaQuotes Software Corp."
#property  link      "http://forum.mql4.com/ru/13708"
#property indicator_separate_window

#property indicator_buffers 2
#property indicator_color1 Lime
#property indicator_color2 Red

#property indicator_level1 0.0001
#property indicator_level2 -0.0001

double entropy[],SignalBuffer[];

extern int numbars=14;
extern int SignalSMA=5;


//+------------------------------------------------------------------+
int init()
{
	SetIndexBuffer(0,entropy);
	SetIndexStyle(0,DRAW_HISTOGRAM);
	IndicatorShortName("Entropy("+numbars+")");
	IndicatorDigits(3*Digits);
	SetIndexBuffer(1,SignalBuffer);
	SetIndexStyle(1,DRAW_LINE);
	IndicatorDigits(3*Digits);
	return(0);
}
//+------------------------------------------------------------------+
int deinit() { return(0); }
//+------------------------------------------------------------------+
int start ()
{
	double  P, G;
	int in, out;
	int i,j;
	double sumx = 0.0;
	double sumx2 = 0.0;
	double avgx = 0.0;
	double rmsx = 0.0;

	in=0;  //price;
	out=0; //entropy;
	int count = IndicatorCounted();

	for (i=0; i<Bars-count+1; i++)
	{
		if (i>Bars-numbars+1) entropy[out] = EMPTY_VALUE;
		else
		{
			sumx = 0; sumx2=0 ; avgx =0; rmsx = 0.0;
			for (j=0;j<numbars+1;j++)
			{
				double r=MathLog(Close[in+j] / Close[in+j+1]) ;
				sumx += r;
				sumx2 += r * r;
			}
		if (numbars==0)  { avgx = Close[in]; rmsx = 0.0; }
		else  { avgx = sumx / numbars; rmsx = MathSqrt(sumx2/numbars); }
		P = ((avgx/rmsx)+1)/2.0;
		G = P * MathLog(1+rmsx) + (1-P) * MathLog(1-rmsx);
		entropy[out]=G;
	}
	in++; out++;
	}

	for(i=0; i<Bars-numbars+1; i++)
      SignalBuffer[i]=iMAOnArray(entropy,Bars,SignalSMA,0,MODE_SMA,i);
}
Comments