EntropyMath
Download script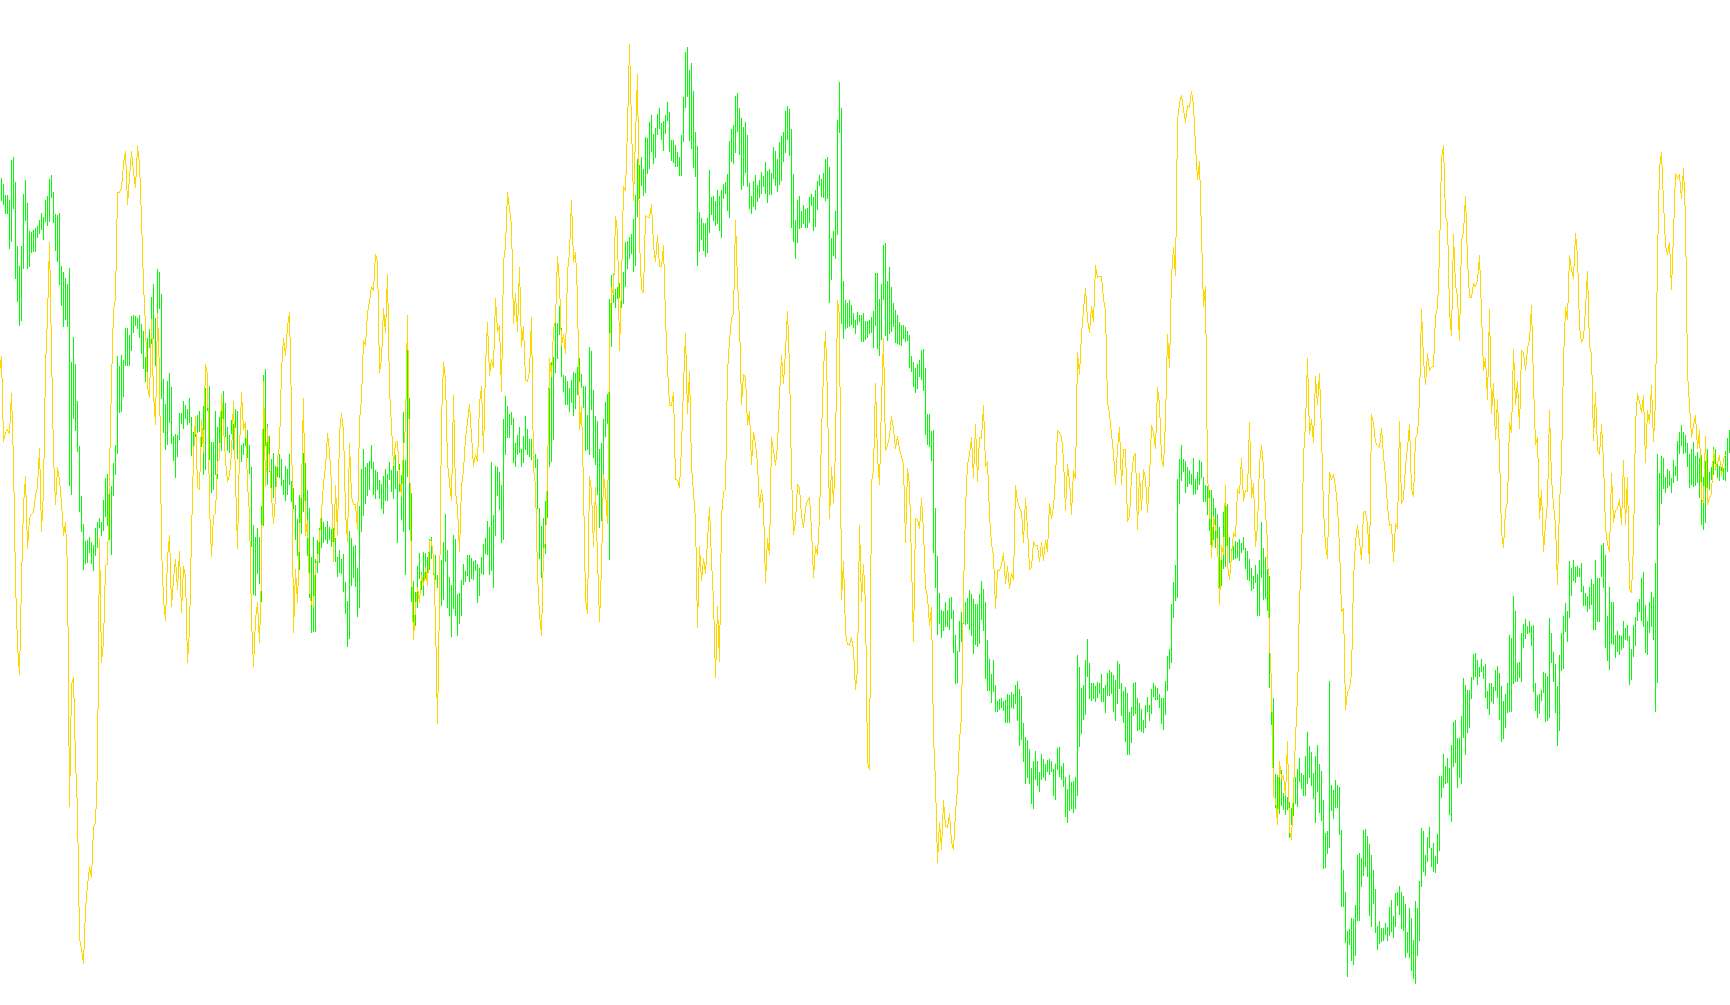
This tool is designed to measure and visualize the level of randomness or "disorder" within price movements on a financial chart. Instead of simply looking at whether a price is going up or down, it analyzes the underlying behavior and consistency of those changes.
How the Logic Works
The script functions by looking at a specific window of recent price data (the number of bars can be customized). It processes this information through three main stages:
1. Calculating Price Changes The tool first looks at the relationship between consecutive closing prices. It calculates the natural growth or decline between each point. Rather than treating every move as an isolated event, it captures the "rhythm" of how the price moves from one moment to the next.
2. Establishing Statistical Foundations Once these changes are identified, the tool performs two primary mathematical calculations:
- Average Movement: It determines the typical size of these price changes over the chosen period.
- Root Mean Square (Volatility): It calculates a measure of variation to see how much the price "swings" away from its average path. This helps the tool distinguish between steady, predictable movement and erratic, volatile behavior.
3. Determining Entropy Finally, the script combines these statistics to produce an "Entropy" value. This value represents the level of predictability in the market:
- When the price moves in a highly organized or consistent manner, the entropy score reflects that stability.
- When the price moves erratically or becomes unpredictable (high disorder), the entropy score shifts accordingly.
Visual Interpretation
The result is displayed as a line in a separate window below your main chart. By observing this line, you can gauge the state of the market's "noise." It allows you to see whether the current price action is behaving with a certain level of mathematical order or if it is entering a phase of chaotic, random movement.
//+------------------------------------------------------------------+
//|                                                  EntropyMath.mq4 |
//|                                         Aleksandr Pak            |
//+------------------------------------------------------------------+

#property  copyright "Copyright © 2008, MetaQuotes Software Corp."
#property  link      "http://forum.mql4.com/ru/13708"
#property indicator_separate_window

#property indicator_buffers 1
#property indicator_color1 Lime
#property indicator_level1 0.0001
#property indicator_level2 -0.0001

double entropy[];

extern int numbars=14;

//+------------------------------------------------------------------+
int init()
{
	SetIndexBuffer(0,entropy); SetIndexStyle(0,DRAW_LINE); IndicatorShortName("Entropy("+numbars+")");
	IndicatorDigits(3*Digits);
	return(0);
}
//+------------------------------------------------------------------+
int deinit() { return(0); }
//+------------------------------------------------------------------+
int start ()
{
	double  P, G;
	int in, out;
	int i,j;
	double sumx = 0.0;
	double sumx2 = 0.0;
	double avgx = 0.0;
	double rmsx = 0.0;

	in=0;  //price;
	out=0; //entropy;
	int count = IndicatorCounted();

	for (i=0; i<Bars-count+1; i++)
	{
		if (i>Bars-numbars+1) entropy[out] = EMPTY_VALUE;
		else
		{
			sumx = 0; sumx2=0 ; avgx =0; rmsx = 0.0;
			for (j=0;j<numbars+1;j++)
			{
				double r=MathLog(Close[in+j] / Close[in+j+1]) ;
				sumx += r;
				sumx2 += r * r;
			}
		if (numbars==0)  { avgx = Close[in]; rmsx = 0.0; }
		else  { avgx = sumx / numbars; rmsx = MathSqrt(sumx2/numbars); }
		P = ((avgx/rmsx)+1)/2.0;
		G = P * MathLog(1+rmsx) + (1-P) * MathLog(1-rmsx);
		entropy[out]=G;
	}
	in++; out++;
	}
}
Comments