Hull Trend
Download script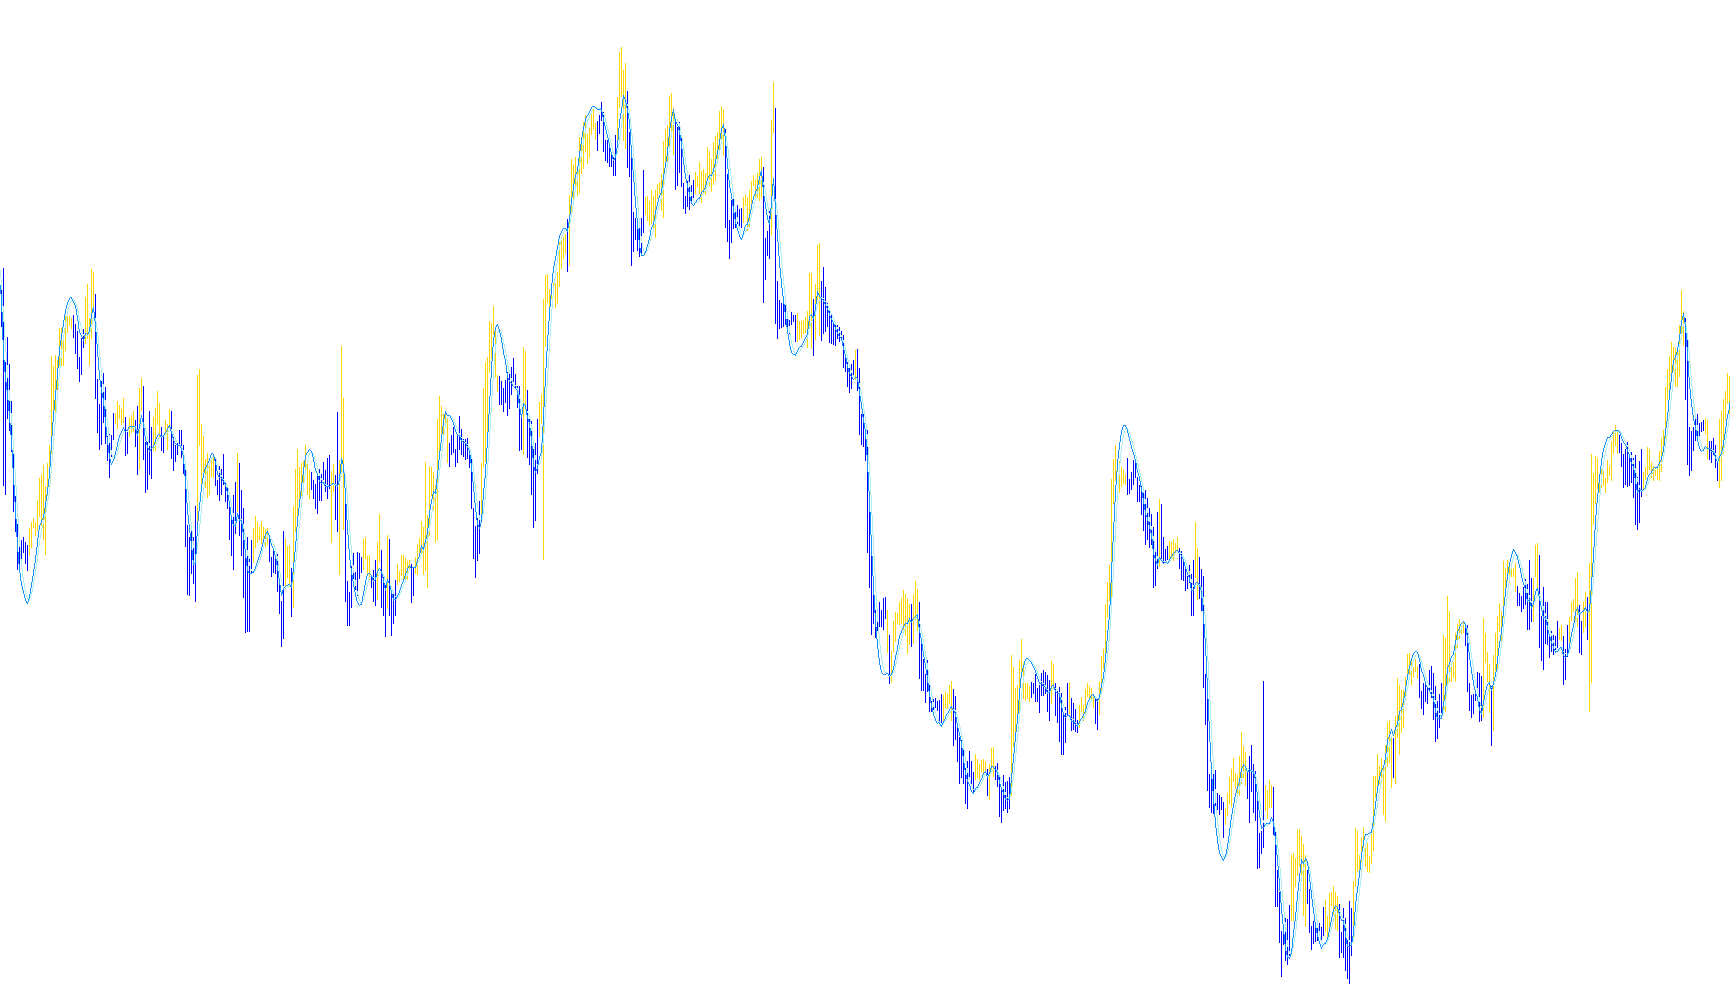
The Hull Trend indicator is a specialized technical analysis tool designed to identify and visualize market trends by smoothing out price fluctuations. Unlike standard moving averages that can sometimes lag behind the current market price, this script utilizes a specific mathematical approach to react more quickly to significant changes in momentum while maintaining a smooth visual representation on your chart.
Core Logic and Mechanism
The indicator operates through a multi-layered calculation process to determine the direction of the trend:
- Dynamic Smoothing: The script first calculates a weighted average of the price. It then creates a "difference" value by comparing a shorter moving average (half the length of your main period) against a longer moving average. This specific difference helps capture the acceleration of price movements.
- Trend Refinement: To ensure the data isn't too erratic or "noisy," the script applies a second layer of smoothing to those differences. By calculating the square root of the main period, it creates a balanced curve that follows the price action closely without the jagged edges typical of basic moving averages.
- Visual Directional Mapping: Once the primary trend line is established, the script compares the current market price positions against these calculated values.
How it Appears on Your Chart
The indicator translates its complex math into clear visual cues to help you navigate the market:
- Trend Identification: The script monitors whether the price is currently positioned above or below the trend threshold.
- Dynamic Highs and Lows: Depending on which side of the trend the price sits, the script identifies "High" and "Low" markers. This allows the indicator to effectively "flip" its orientation based on the market's momentum.
- Color and Shape Cues: The results are displayed as solid histograms. When the trend is bullish (upward), the indicators highlight the price peaks; when the trend turns bearish (downward), they shift to highlight the price troughs, providing a clear visual signal of the prevailing market sentiment.
Key Settings
- HMA_Period: This is the primary "speed" setting. A higher number will result in a smoother, slower-moving trend line that ignores minor fluctuations, while a lower number will make the indicator more sensitive to immediate price changes.
- Price: This defines which data point the indicator tracks (usually the closing price of a candle).
- Displacement: This allows for a slight offset in the calculation, which can be used to fine-tune how the trend reacts to the very latest price movements.
Indicators Used
Miscellaneous
14
Views
0
Downloads
0
Favorites
Hull Trend
//+------------------------------------------------------------------+
//|                                                   Hull Trend.mq4 |
//|                                     Copyright © 2005, adoleh2000 |
//|                                             adoleh2000@yahoo.com |
//+------------------------------------------------------------------+
#property  copyright "Copyright © 2005, adoleh2000."
#property  link      "adoleh2000@yahoo.com"
//---- indicator settings
#property  indicator_chart_window
#property  indicator_buffers 4
#property  indicator_color1  Blue
#property  indicator_color2  Red
#property  indicator_color3  EMPTY
#property  indicator_color4  EMPTY


//---- indicator parameters
extern int HMA_Period=20;
extern double Price=PRICE_CLOSE;
extern double Displacement=0;
//---- indicator buffers
double ind_buffer0[];
double ind_buffer1[];
double HighBuffer[];
double LowBuffer[];


int        draw_begin0;

//+------------------------------------------------------------------+
//| Custom indicator initialization function                         |
//+------------------------------------------------------------------+
int init()
  {
//---- indicator buffers mapping
   //IndicatorBuffers(4);
//   ArraySetAsSeries(ind_buffer1,true);
//---- drawing settings
   SetIndexStyle(0,DRAW_HISTOGRAM,STYLE_SOLID,1);
   SetIndexStyle(1,DRAW_HISTOGRAM,STYLE_SOLID,1);
   SetIndexStyle(2,DRAW_LINE,STYLE_SOLID,1);
   SetIndexStyle(3,DRAW_LINE,STYLE_SOLID,1);


   SetIndexBuffer(0,HighBuffer);
   SetIndexBuffer(1,LowBuffer);
   SetIndexBuffer(2,ind_buffer0);
   SetIndexBuffer(3,ind_buffer1);


   draw_begin0=HMA_Period+MathFloor(MathSqrt(HMA_Period));

   SetIndexDrawBegin(0,draw_begin0);
   SetIndexDrawBegin(1,draw_begin0);
   SetIndexDrawBegin(2,draw_begin0);
   SetIndexDrawBegin(3,draw_begin0);

   IndicatorDigits(MarketInfo(Symbol(),MODE_DIGITS)+1);
//---- name for DataWindow and indicator subwindow label
   IndicatorShortName("HMA("+HMA_Period+")");
   SetIndexLabel(0,"Hull Moving Average");
//---- initialization done
   return(0);
  }
//+------------------------------------------------------------------+
//| Moving Averages Convergence/Divergence                           |
//+------------------------------------------------------------------+
int start()
  {
   int limit,i,shift;
   int counted_bars=IndicatorCounted();
//---- check for possible errors
   if(counted_bars<1)
     {
      for(i=1;i<=draw_begin0;i++) ind_buffer0[Bars-i]=0;
      for(i=1;i<=HMA_Period;i++) ind_buffer1[Bars-i]=0;
     }
//---- last counted bar will be recounted
   if(counted_bars>0) counted_bars--;
   limit=Bars-counted_bars;
//---- MA difference counted in the 1-st buffer
   for(i=0; i<limit; i++)
      ind_buffer1[i]=iMA(NULL,0,MathFloor(HMA_Period/2),0,MODE_LWMA,Price,i)*2-iMA(NULL,0,HMA_Period,0,MODE_LWMA,Price,i);
//---- HMA counted in the 0-th buffer
   for(i=0; i<limit; i++)
      ind_buffer0[i]=iMAOnArray(ind_buffer1,0,MathFloor(MathSqrt(HMA_Period)),0,MODE_LWMA,i+Displacement);

      //Comment ("MA=",ind_buffer1[i],"; ","HMA=",ind_buffer0[i]);

for (shift=i; shift>=0;shift--)
{
      if (ind_buffer1[shift] > ind_buffer0[shift])
   {
      HighBuffer[shift]=High[shift];
      LowBuffer[shift]=Low[shift];
   }

   else

if (ind_buffer1[shift]<  ind_buffer0[shift])
   {
      LowBuffer[shift]=High[shift];
      HighBuffer[shift]=Low[shift];
    }
}
//---- done
   return(0);
  }
Comments