Heiken Ashi v2
Download script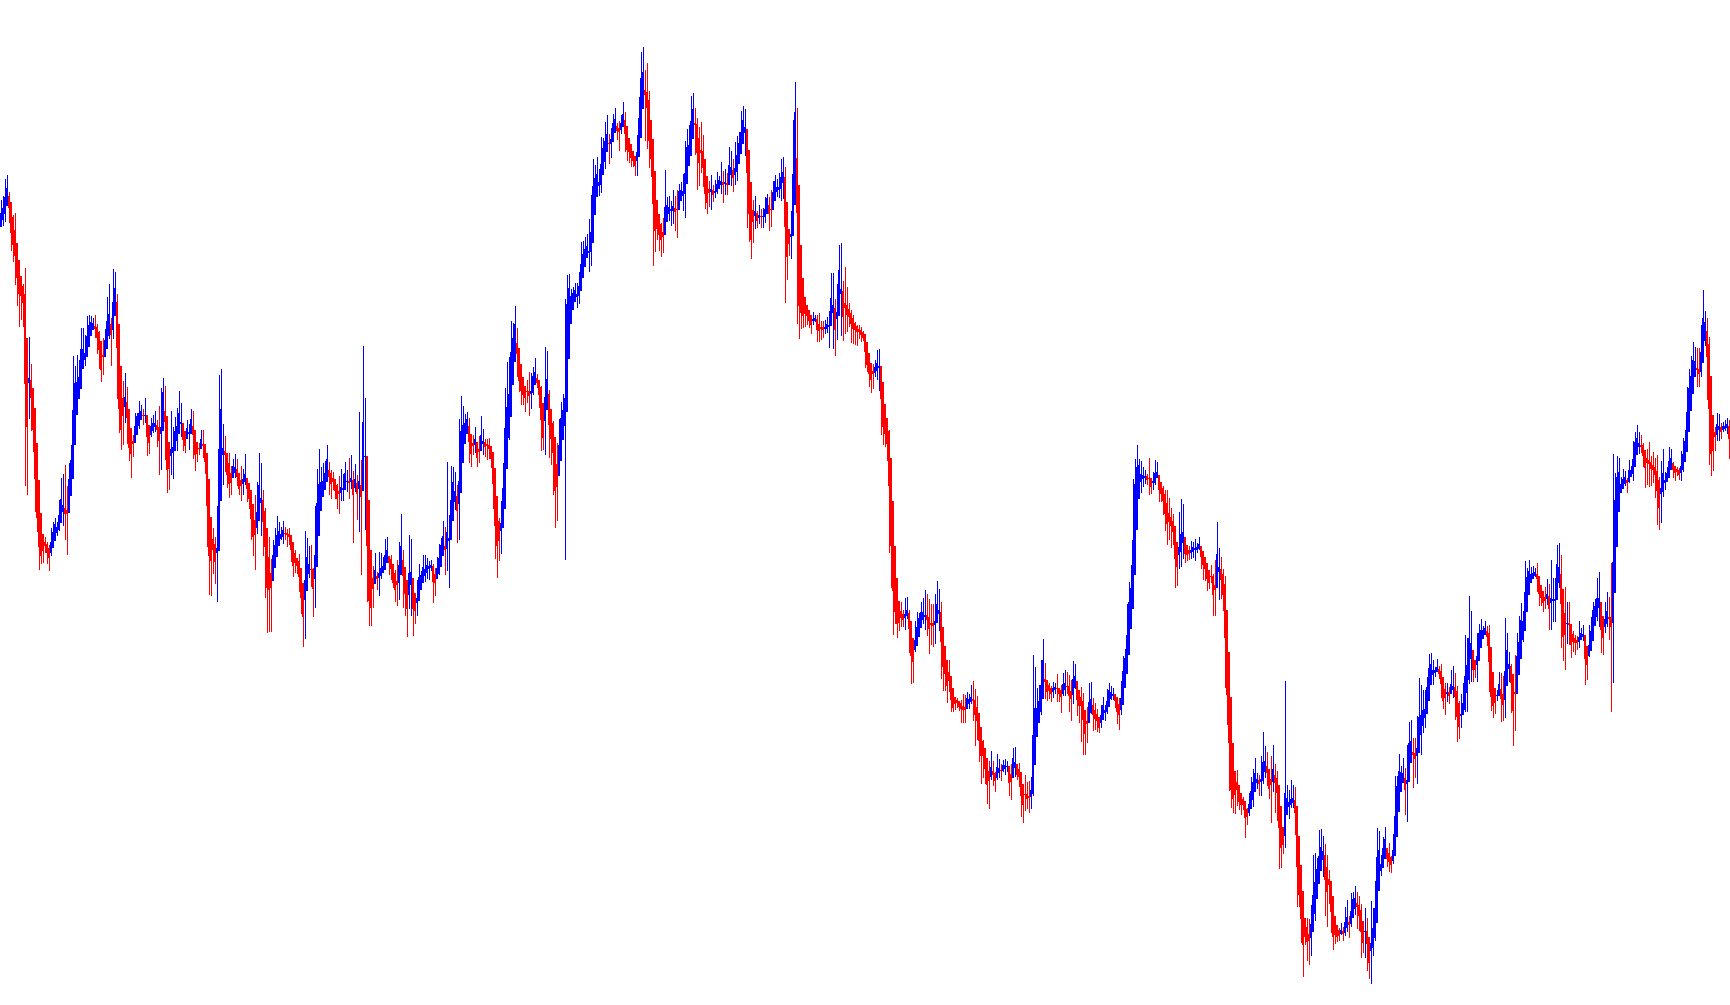
This tool is designed to provide traders with a visual representation of price action that focuses on trend momentum rather than individual price fluctuations. It transforms standard candlestick data into a specialized format known as "Heiken Ashi," which helps smooth out market "noise" to reveal the underlying direction of the trend more clearly.
How the Logic Works
The script processes historical price data to generate four specific types of visual information on your chart:
1. Trend Smoothing (Opening and Closing Values) Instead of looking at the raw price, the script calculates a new "smoothed" open and close for every bar.
- The Close value is derived by taking the average of the entire current candlestick (High, Low, Open, and Close).
- The Open value is calculated based on the previous bar's data. By using these averages, the tool helps identify whether the market sentiment is shifting progressively in one direction or if it is experiencing erratic volatility.
2. High and Low Extremes The script also identifies the "true" high and low points for each smoothed period. It compares the actual market highs and lows against the newly calculated smoothed open and close values. It then selects the highest and lowest points among them to ensure the visual range accurately captures the boundaries of price movement during that specific period.
3. Visual Color Coding The logic uses a binary system to determine the color of the bars displayed on your screen:
- If the smoothed closing price is higher than the smoothed opening price, it indicates upward momentum.
- If the smoothed closing price is lower than the smoothed opening price, it indicates downward momentum.
Summary for the User
By applying this logic, the chart becomes much easier to read at a glance. Rather than seeing every minor "wick" or fluctuation, you see a continuous flow of color and shape. This allows you to see the strength of a trend more clearly—helping you identify when a market is truly gaining steam or when it is beginning to lose its momentum, providing a cleaner perspective for making informed trading decisions.
//+------------------------------------------------------------------+
//|                                               Heiken Ashi v2.mq4 |
//|                      Copyright c 2004, MetaQuotes Software Corp. |
//|                                        http://www.metaquotes.net |
//+------------------------------------------------------------------+
#property copyright "Copyright © 2004, MetaQuotes Software Corp."
#property link      "http://www.metaquotes.net"

#property indicator_chart_window
#property indicator_buffers 4
#property indicator_color1 Red
#property indicator_color2 Blue
#property indicator_color3 Red
#property indicator_color4 Blue

//---- buffers
   double
      ExtMapBuffer1[],
      ExtMapBuffer2[],
      ExtMapBuffer3[],
      ExtMapBuffer4[];

//---- vars
   int
      ExtCountedBars=0;

int init() {

   //---- indicators
   SetIndexStyle  (0, DRAW_HISTOGRAM, 0, 1, Red);
   SetIndexBuffer (0, ExtMapBuffer1);
   SetIndexLabel  (0, "HA Max / Min");
   SetIndexStyle  (1, DRAW_HISTOGRAM, 0, 1, Blue);
   SetIndexBuffer (1, ExtMapBuffer2);
   SetIndexLabel  (1, "HA Max / Min");
   SetIndexStyle  (2, DRAW_HISTOGRAM, 0, 3, Red);
   SetIndexBuffer (2, ExtMapBuffer3);
   SetIndexLabel  (2, "HA Open");
   SetIndexStyle  (3, DRAW_HISTOGRAM, 0, 3, Blue);
   SetIndexBuffer (3, ExtMapBuffer4);
   SetIndexLabel  (3, "HA Close");

   //----
   SetIndexDrawBegin(0, 10);
   SetIndexDrawBegin(1, 10);
   SetIndexDrawBegin(2, 10);
   SetIndexDrawBegin(3, 10);

   //---- indicator buffers mapping
   SetIndexBuffer(0, ExtMapBuffer1);
   SetIndexBuffer(1, ExtMapBuffer2);
   SetIndexBuffer(2, ExtMapBuffer3);
   SetIndexBuffer(3, ExtMapBuffer4);

   IndicatorDigits(Digits);
   return(0);
}

//+------------------------------------------------------------------+
//| Custom indicator iteration function                              |
//+------------------------------------------------------------------+
int start() {

   double
      haOpen,
      haHigh,
      haLow,
      haClose;

   int
      pos = Bars - ExtCountedBars - 1;

   if( Bars <= 10 ) {
      return(0);
   }
   ExtCountedBars = IndicatorCounted();
   //---- check for possible errors
   if ( ExtCountedBars < 0 ) {
      return(-1);
   }
   //---- last counted bar will be recounted
   if ( ExtCountedBars > 0 ) {
      ExtCountedBars--;
   }

   while( pos >= 0 ) {
      haOpen   = (ExtMapBuffer3[pos + 1] + ExtMapBuffer4[pos + 1]) / 2;
      haClose  = (Open[pos] + High[pos]  + Low[pos] + Close[pos])  / 4;
      haHigh   = MathMax(High[pos], MathMax(haOpen, haClose));
      haLow    = MathMin(Low[pos],  MathMin(haOpen, haClose));
      if ( haOpen < haClose) {
         ExtMapBuffer1[pos] = haLow;
         ExtMapBuffer2[pos] = haHigh;
      } else {
         ExtMapBuffer1[pos] = haHigh;
         ExtMapBuffer2[pos] = haLow;
      }
      ExtMapBuffer3[pos] = haOpen;
      ExtMapBuffer4[pos] = haClose;
 	   pos--;
   }
   return(0);
}
Comments