CCI_arrow
Download script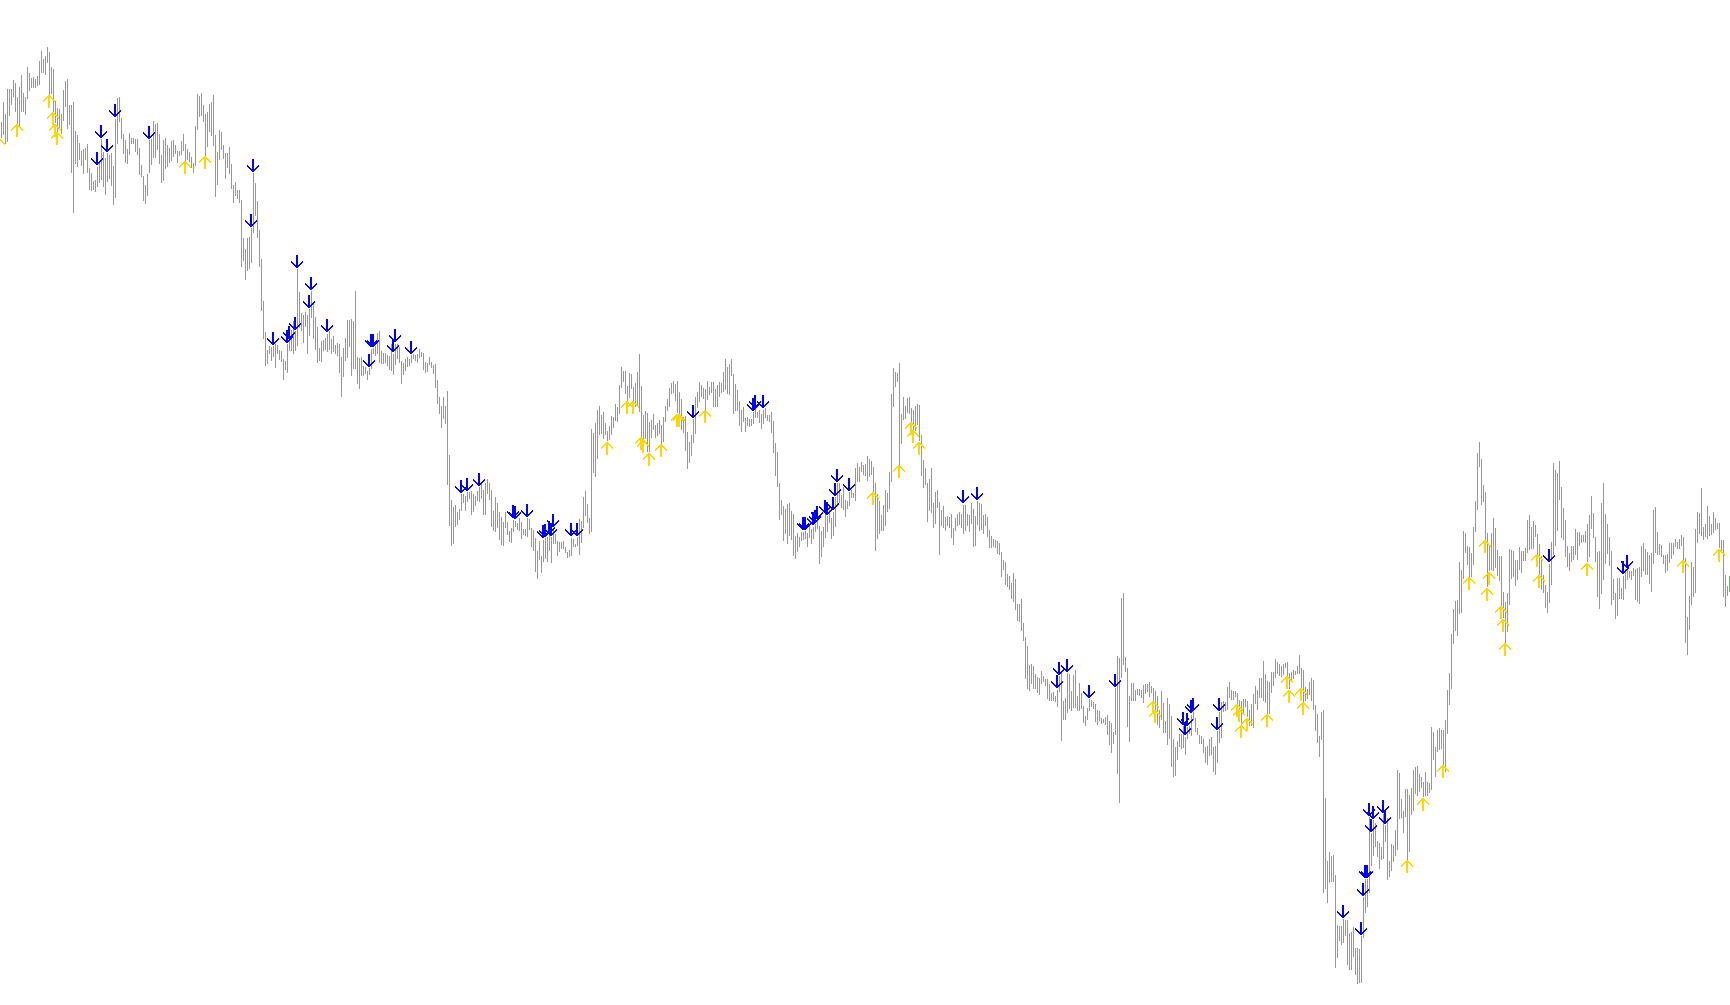
This tool is designed as a visual trading assistant for the MetaTrader platform. Its primary purpose is to identify potential turning points in market momentum by highlighting specific price actions with on-screen arrows. Instead of cluttering your chart with complex lines, it acts as a simplified "signal" system that flags moments where high volatility and trend reversals might be occurring.
How the Logic Works
The script functions by monitoring two different mathematical rhythms of the market simultaneously. It uses a technical metric called the "Commodity Channel Index" (CCI), which measures how far the current price is deviating from its average over a specific timeframe.
The logic operates on the interaction between these two rhythms:
- The Fast Rhythm (Short-term): This looks at very recent price movements (over a short period). It reacts quickly to sudden spikes or drops in price.
- The Slow Rhythm (Long-term): This looks at the broader trend over a much longer duration, providing a "big picture" view of where the market is heading.
Signal Generation
The script only places an arrow on your chart when these two rhythms agree on a specific type of "extreme" behavior:
- Sell Signals (Yellow Arrows): The script looks for a situation where the short-term momentum has spiked significantly high (exceeding a predefined control limit), while the long-term trend is still showing a downward lean or neutrality. When these two conditions meet, it suggests that the price may have become "overextended" to the upside and could be due for a pullback.
- Buy Signals (Aqua Arrows): Conversely, the script looks for moments where the short-term momentum has dropped significantly low, while the long-term trend remains positive or neutral. This indicates that the price may have been pushed down too far in the short term and might be reaching a point of "oversold" exhaustion, potentially leading to an upward move.
Visual Output
The script automates this entire calculation process for you. Every time these specific mathematical conditions are met, it automatically plots an arrow on your chart:
- An Aqua arrow appears below the price candles to suggest a potential buying opportunity.
- A Yellow arrow appears above the price candles to suggest a potential selling opportunity.
By using this tool, you can filter out much of the "noise" of the market and focus on specific moments where short-term volatility intersects with long-term trend data.
#property indicator_chart_window

#property indicator_buffers 2

#property indicator_color1 Aqua
#property indicator_color2 Yellow


//---- input parameters

extern int period_cci1=5;
extern int period_cci2=50;
extern int Control=80;


extern double DI=30;// Ñêîëüêî ïîèíòîâ îòñòóïàòü äëÿ îòðèñîâóêè
//---- buffers


double UP[];
double DN[];


//+------------------------------------------------------------------+
//| Custom indicator initialization function                         |
//+------------------------------------------------------------------+
int init()
  {
  //---- 2 additional buffers are used for counting.
   IndicatorBuffers(2);

//---- indicator lines
   SetIndexStyle(0,DRAW_ARROW,EMPTY,1);
   SetIndexBuffer(0,UP);
   SetIndexArrow(0,225);

   SetIndexStyle(1,DRAW_ARROW,EMPTY,1);
   SetIndexBuffer(1,DN);
   SetIndexArrow(1,226);


//---- name for DataWindow and indicator subwindow label
//----


//----
   return(0);
  }
//+------------------------------------------------------------------+
//| Stochastic oscillator                                            |
//+------------------------------------------------------------------+
int start()
{  double cci1,cci2;
    for(int i=MathMax(Bars-1-IndicatorCounted(),1); i>=0; i--){
      DN[i]=EMPTY_VALUE;
      UP[i]=EMPTY_VALUE;
      cci1=iCCI(Symbol(),0,period_cci1,0,i);
      cci2=iCCI(Symbol(),0,period_cci2,0,i);
      if(cci1>Control && cci2<0)DN[i]=High[i]+DI*Point;
      if(cci1<((-1)*Control) && cci2>0)UP[i]=Low[i]-DI*Point;

                                                              }
}
Comments