Brooky_ma_close
Download script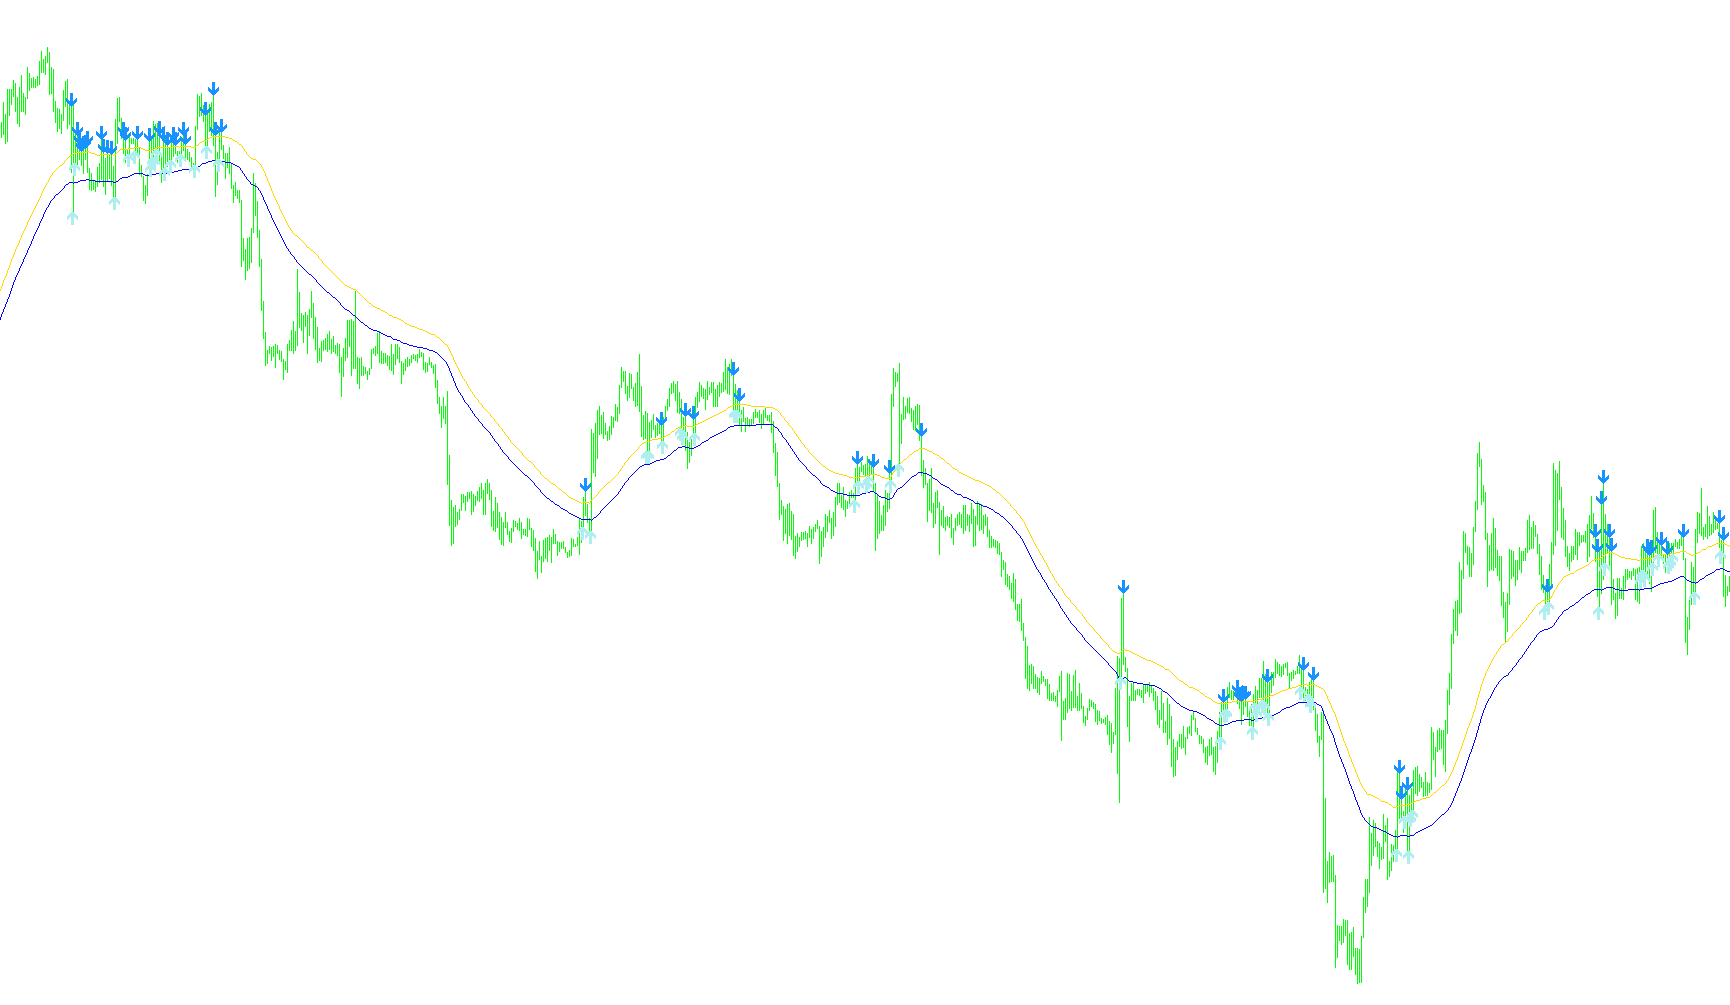
This script is designed as a technical analysis tool for the MetaTrader platform, specifically created to help traders identify potential price reversals and trend shifts by monitoring specific price movements relative to moving averages.
Core Mechanics
The indicator functions by calculating two distinct types of "Moving Averages." Rather than looking at the standard closing prices of candles, it focuses on the extreme boundaries of the market:
- The High Average: Tracks the smoothed highs of recent price action.
- The Low Average: Tracks the smoothed lows of recent price action.
By establishing these two "boundaries," the script creates a dynamic framework that follows the current trend of the market.
Signal Logic
The primary goal of this script is to detect "rejection" signals—moments where the price pushes toward a boundary but fails to sustain its momentum, potentially indicating a turn in direction. The logic evaluates every candle based on the following rules:
1. High-Side Rejections (Bearish Potential) When the user enables the "High" signal settings, the script looks for instances where:
- The price reaches above the High Average boundary.
- The price then fails to stay above that boundary, closing back inside it. This suggests that buyers were exhausted, and a downward move might be looming.
2. Low-Side Rejections (Bullish Potential) When the "Low" signal settings are active, the script identifies scenarios where:
- The price dips below the Low Average boundary.
- The price recovers and closes back above that boundary. This suggests that sellers were exhausted, and an upward move might be beginning.
Visual Output
To make these signals easy for a trader to read in real-time, the script translates these mathematical conditions into visual markers on the chart:
- Upward Arrows: These appear below the price action when the logic detects a recovery from a low point, signaling a potential buying opportunity.
- Downward Arrows: These appear above the price action when the logic detects a rejection of a high point, signaling a potential selling opportunity.
In summary, this tool filters out market "noise" by focusing on how the price interacts with its historical highs and lows, providing visual cues for traders looking to spot reversal points in volatile markets.
//+------------------------------------------------------------------+
//|                                              Brooky_ma_close.mq4 |
//|                      Copyright © 2010, MetaQuotes Software Corp. |
//|                                        http://www.metaquotes.net |
//+------------------------------------------------------------------+
#property copyright "Copyright © 2010, MetaQuotes Software Corp."
#property link      "http://www.metaquotes.net"

#property indicator_chart_window
#property indicator_buffers 4

#property indicator_color1 DodgerBlue
#property indicator_color2 Orange

#property indicator_color3 Green
#property indicator_color4 Red
//---- input parameters
extern int       ma_period=34;
extern int       ma_mode=2;
extern bool      sig_on_high = true;
extern bool      sig_on_low  = false;
//---- buffers
double mah[];
double mal[];
double aup[];
double adn[];
//+------------------------------------------------------------------+
//| Custom indicator initialization function                         |
//+------------------------------------------------------------------+
int init()
  {
//---- indicators
   SetIndexBuffer(0,mah);SetIndexStyle(0,DRAW_LINE);
   SetIndexBuffer(1,mal);SetIndexStyle(1,DRAW_LINE);

   SetIndexStyle(2,DRAW_ARROW);
   SetIndexArrow(2,233);
   SetIndexBuffer(2,aup);
   SetIndexEmptyValue(2,0.0);

   SetIndexStyle(3,DRAW_ARROW);
   SetIndexArrow(3,234);
   SetIndexBuffer(3,adn);
   SetIndexEmptyValue(3,0.0);
//----
   return(0);
  }

//+------------------------------------------------------------------+
//| Custom indicator iteration function                              |
//+------------------------------------------------------------------+
  int start()
    {
     int limit;
     int counted_bars=IndicatorCounted();
  //---- check for possible errors
     if(counted_bars<0) return(-1);
  //---- the last counted bar will be recounted
     if(counted_bars>0) counted_bars--;
     limit=Bars-counted_bars;
  //---- main loop
     double h,l,c,mh,ml;
     for(int i=0; i<limit; i++)
       {
        mah[i]=iMA(NULL,0,ma_period,0,ma_mode,PRICE_HIGH,i);
        mal[i]=iMA(NULL,0,ma_period,0,ma_mode,PRICE_LOW,i);

        mh=mah[i];
        ml=mal[i];

        h=iHigh(NULL,0,i);
        l=iLow(NULL,0,i);
        c=iClose(NULL,0,i);

        if(sig_on_high)
        {
         if(l<mh && c>mh)aup[i]=iLow(NULL,0,i)-20*Point;
         if(h>mh && c<mh)adn[i]=iHigh(NULL,0,i)+20*Point;
        }
        if(sig_on_low)
        {
         if(l<ml && c>ml)aup[i]=iLow(NULL,0,i)-20*Point;
         if(h>ml && c<ml)adn[i]=iHigh(NULL,0,i)+20*Point;
        }

       }
  //---- done
     return(0);
    }
//+------------------------------------------------------------------+
Comments